
People Counting Systems in Art Galleries: Visitor and Exhibition Analysis
People counting systems in art galleries help analyze exhibition performance, area density, visitor experience, and sales conversion by measuring visitor traffic. We examine 3D people counting sensors, AI-powered visitor analytics, artwork interest areas, opening events, accuracy measurement, and KVKK requirements.
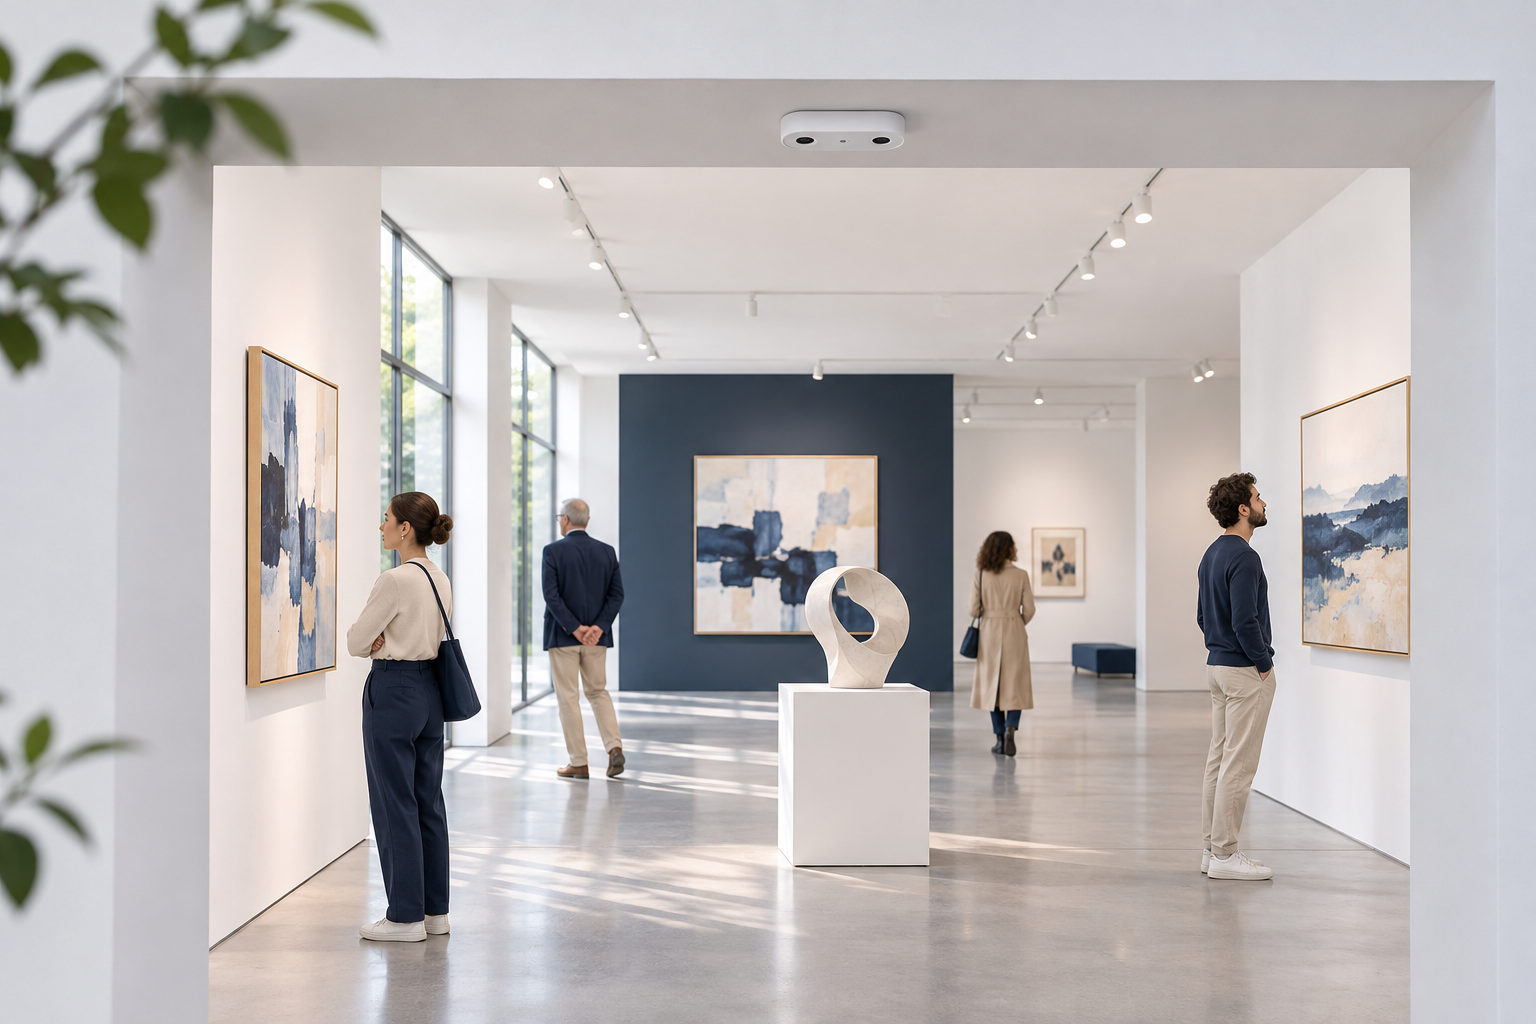
In art galleries, the number of visitors is an important performance indicator for evaluating the reach of exhibitions, the physical use of the gallery, and visitor interest. However, knowing only the daily visitor count is not enough to understand the success of an art gallery. It is also important to know which exhibitions are visited more, which areas visitors concentrate in, how much interest opening events generate, and how visitor traffic translates into sales discussions.
People counting systems in art galleries are technological solutions that automatically measure visitors' entry and exit movements, analyze the usage density of specific exhibition sections, and convert this data into meaningful reports with appropriate software infrastructure.
Thanks to 3D people counting sensors, AI-powered image analytics, and other suitable detection methods, galleries can evaluate visitor mobility on a daily, weekly, monthly, or exhibition-period basis.
The purpose of these systems is not just to count visitors, but to understand how the physical spaces where artworks are exhibited are used, with measurable data.
However, visitor traffic, the actual time spent examining artworks, commercial interest, and sales success are different indicators. For accurate analysis, these concepts must be separated.
What is a People Counting System in Art Galleries?
An art gallery people counting system is a combination of hardware and software that automatically detects people passing through designated entry and exit points and records their passage information on a time-based basis.
Internationally, these solutions are referred to by terms such as Art Gallery People Counting, Gallery Visitor Analytics, Footfall Analytics, and Exhibition Visitor Tracking.
Depending on the technology used and the scope of the project, the system can provide the following data:
Daily, weekly, and monthly entry counts to the gallery.
Visitor movements in entry and exit directions.
Peak visitor hours.
Traffic data related to exhibition openings.
Entry counts to specific exhibition halls.
Estimated real-time gallery occupancy.
Usage density of different artwork or collection areas.
Dwell time in specific areas in supported analytical systems.
Changes in visitor traffic between exhibition periods.
Comparison of visitor traffic with sales and event data through appropriate integrations.
However, there is a fundamental technical distinction:
The number of gallery entries, the number of unique visitors, interaction with artworks, and the number of visitors who convert to sales are not the same data.
For example, if a visitor leaves the gallery and re-enters on the same day, a standard entry counter might record two entry movements. This does not mean that two different people visited the gallery.
Therefore, it is important to clearly define the indicators to be measured before the system is installed.
Why is Visitor Counting Important in Art Galleries?
Art galleries are special venues where commercial activities, cultural events, and visitor experience coexist.
For private art galleries, visitor traffic can help assess potential buyer interest, while for art centers and non-profit galleries, it can contribute to measuring the social reach of exhibitions.
Measuring Exhibition Performance
An art gallery may exhibit works by different artists throughout the year.
Visitor interest in each exhibition may not be at the same level.
For example, a contemporary painting exhibition, a sculpture exhibition, and a photography exhibition may have different visitor profiles or visitor densities.
Thanks to people counting systems, gallery management can compare the exhibitions':
Total visitor entries.
Average daily visitor traffic.
Density during the opening event.
Weekday and weekend visitor distribution.
Traffic change in the first and last weeks of the exhibition.
However, if the exhibition durations are different, comparing only total visitor numbers can be misleading.
Therefore, normalized indicators such as average visitor traffic per open day or hour should also be used.
Evaluating the Effectiveness of Exhibition Openings
One of the important events for art galleries is exhibition openings.
On opening days, artists, collectors, art professionals, and invited guests may be present in the same space.
People counting systems can show:
Total entries during opening hours.
The busiest time intervals of the event.
How long the entry density continued.
The traffic difference between the opening day and normal exhibition days.
This data can be used for planning guest reception, catering, consultation, and gallery staff for subsequent openings.
However, the number of invited guests, event registration count, and actual attendance are different.
For example, a guest list of 200 people does not mean that 200 people attended the event.
Improving Visitor Experience
In art galleries, it is important for visitors to be able to examine artworks in a comfortable environment.
Excessive density in certain exhibition halls can make it difficult to view artworks or affect the visitor experience in the area.
With density data, the exhibition plan, signage layout, and staff distribution can be re-evaluated.
However, a high visitor count alone does not prove a bad experience. It should be interpreted in conjunction with observation, feedback, and visitor surveys.
Exhibition-Based Visitor Analysis in Art Galleries
In art galleries with multiple halls, counting only the main entrance is not sufficient to explain the performance of all exhibitions.
If there are different exhibition sections within the gallery, the entry and exit movements of these areas can be measured separately using appropriate sensors.
Traffic Distribution Between Exhibition Halls
For example, let's assume visitor movements in a gallery with three exhibition halls are recorded as follows:
Exhibition area | Daily entry movement | Ratio to main gallery entries |
|---|---|---|
Main gallery entrance | 300 | %100 |
Hall A – Painting exhibition | 240 | %80 |
Hall B – Sculpture exhibition | 180 | %60 |
Hall C – Photography exhibition | 150 | %50 |
The numbers in the table are hypothetical data for illustrative purposes; they are not taken from a real art gallery.
This data may indicate that Hall A receives higher entry traffic.
However, the ratios should not be interpreted as the rate at which unique individuals visit the halls. Repeated hall entries may belong to the same person.
Furthermore, higher traffic in Hall A does not definitively indicate that the exhibited artworks are more appreciated by visitors.
Factors such as exhibition order, hall location, accessibility, and signage layout can also affect the results.
Evaluating Exhibition Placement
In some galleries, certain halls may be visited less than other sections.
Reasons for this may include:
Lack of internal gallery signage.
Exhibition entrance not being noticed.
Transition layout between spaces.
Busy entry points.
Structure of the visitor route.
Accessibility conditions of specific areas.
People counting data provides a starting point for investigating these possible reasons.
Can Visitor Interest in Artworks Be Measured?
In art galleries, understanding not only visitor entries but also the use of areas where specific artworks are located can be valuable.
However, a standard people counting sensor alone does not measure which artwork is being carefully examined.
Such analyses may require different detection and visitor research methods.
Dwell Time in Front of Artwork
Dwell time refers to the duration a visitor spends in a specific area or defined viewing zone.
Appropriate analytical systems can generate estimates of how long individuals stay in designated artwork or collection sections.
For example, the average dwell time in the area of an artwork might be measured as longer than in another area.
This may indicate that the relevant area attracts visitors' time more.
However, a person staying for a long time near an artwork does not necessarily mean they are carefully examining it or intend to purchase it.
Crowds, waiting, guided narration, or the area being on a transit route can also affect dwell time.
The University of Cambridge Museum of Archaeology and Anthropology recommends evaluating stopping points, dwell times, and movement routes together in visitor observation.
Heatmaps
In supported analytical systems, heatmaps can be generated to show where visitors are most concentrated.
Heatmaps in the gallery can help examine:
Busy transit routes.
Areas where visitors gather.
Less used sections.
Traffic distribution based on exhibition layout.
However, not all basic entry counting sensors can generate heatmaps.
Also, a density heatmap and a system that tracks the visit route of specific individuals are not the same technology.
Limitations of Artwork Interest Analysis
To understand the number of visitors showing interest in a particular painting, presence detection in front of the artwork, area-based video analytics, or structured observation methods can be considered.
In interpreting actual artwork interaction, different behaviors such as the visitor turning towards the artwork, stopping, reading the explanatory text, or watching a guided narration may be important.
It is not possible to obtain all of these from a single people counting device.
People Counting Technologies Used in Art Galleries
Sensor technologies that can be used in art galleries have different operating principles.
3D People Counting Sensors
3D people counting technologies can detect people's passages using stereoscopic imaging or other depth measurement methods.
Appropriate ceiling-mounted devices can perform counting by distinguishing between entry and exit directions.
This technology can be particularly useful at gallery entrances and door passages between exhibition halls.
Advantages of suitable models include:
Bi-directional counting.
Utilizing depth data when people pass close to each other.
Centralized reporting.
Monitoring multiple entrances together.
However, not every 3D sensor has the same technology or the same performance.
AI-Powered Video Analytics
AI-based image analysis can perform people detection and specific movement analyses using compatible cameras and software.
In some applications, regional density analysis can also be performed along with entry counting.
However, the ability of a standard CCTV camera to detect humans does not mean it is suitable for high-accuracy people counting.
Camera angle, overlap, visitor density, lighting, and the intended use of the software should be evaluated separately.
For more information, GüvenlikOnline's article Video Analytics Systems: AI and Technical Selection Guide can be reviewed.
Infrared (IR) People Counters
In infrared beam-based systems, counting can be done by people passing through a specific line interrupting the sensor beam.
These systems can be evaluated for small and controlled entrances.
However, people passing side-by-side, group movements, and different passage behaviors can affect counting accuracy.
Thermal and mmWave Detection
Certain thermal and mmWave sensors can be used for evaluating human presence and movement.
These technologies can provide detection capabilities without using visible light images in suitable applications.
However, a thermal or mmWave device detecting presence does not automatically mean it can perform accurate bi-directional people counting or artwork-based dwell time analysis.
Technology Comparison
Technology | Prominent use | Key limitation |
|---|---|---|
3D people counting | Gallery and hall entrances | Mounting geometry and overlap |
AI video analytics | Entry and suitable area density analysis | Perspective, image processing, and privacy |
IR beam sensor | Narrow and controlled passage | Side-by-side group passages |
Thermal people counting | Suitable entry and motion detection | Environmental thermal conditions |
mmWave sensor | Presence and suitable motion analysis | Device-specific resolution and multi-person separation |
Manual counting | Reference measurement and small events | Personnel requirement, human error |
The most accurate technology is not the most expensive or the newest technology. The solution appropriate for the gallery's entrance architecture, visitor profile, and required data type should be preferred.
Real-time Occupancy and Visitor Density in Art Galleries
Knowing how many people are in an art gallery at the same time can help with operational planning, especially during exhibition openings and special events.
Estimated real-time occupancy can be calculated with properly measured entry and exit data.
For example, if 120 people entered an initially empty gallery and 35 people exited, the estimated number of people inside would be 85.
However, for this calculation to be reliable, it requires:
Counting all relevant entries and exits.
Correctly defining counting directions.
Knowing the initial occupancy.
Regularly checking for counting errors.
Determining the scope of staff and visitors.
Sensor-related undercounts or overcounts can accumulate over time, leading to deviations in occupancy calculations.
Furthermore, the occupancy estimate generated by the people counting system does not replace the legal capacity determined in the relevant fire project and regulations.
How to Calculate Sales Conversion Rate in Art Galleries?
In commercial art galleries, comparing visitor traffic with sales processes can help evaluate business performance.
However, the purchasing process for artworks may have different characteristics than standard retail products.
A collector may examine an artwork on their first visit, then contact the gallery, and make a purchase decision days or weeks later.
Therefore, people counting data should be carefully correlated with sales reports.
Conversion from Visitor to Sales Discussion
It is possible to track how many visitors to the gallery convert into a recorded sales discussion.
For example, if 500 visitor entries and 40 qualified sales discussions were recorded during an exhibition period:
This result shows that the number of discussions is 8% relative to visitor entries.
However, a person may visit again or have multiple discussions. Therefore, this ratio should not be directly interpreted as the conversion rate of unique visitors.
Visitor Traffic and Artwork Sales
For example, in a gallery over one month:
Performance indicator | Example value |
|---|---|
Gallery entries | 800 |
Qualified sales discussions | 56 |
Number of artworks sold | 7 |
Discussion rate per entry | %7 |
Artwork sold rate per entry | %0.875 |
This table is entirely hypothetical. Due to the possibility of the same buyer purchasing multiple artworks or sales occurring through other channels, the final ratio is not a unique customer conversion.
Such reports can be helpful in comparing different exhibition periods.
However, it should be remembered that art sales are influenced by many factors such as artwork price, artist recognition, collector relationships, gallery activities, and online communication.
A people counting system does not directly measure purchase intent.
Important KPIs for Art Galleries
The data provided by a people counting system in art galleries can be converted into specific performance indicators with appropriate analytical infrastructure.
KPI | What it measures? | Purpose of use |
|---|---|---|
Daily visitor entries | Entry movements to the gallery | Daily traffic analysis |
Hourly visitor density | Entries at specific hours | Staff and event planning |
Traffic per open hour | Entries / hours open | Comparing exhibition periods |
Hall visit traffic | Entries to specific exhibition areas | Evaluating exhibition placement |
Estimated real-time occupancy | Net entry-exit balance | Density monitoring |
Regional dwell time | Time spent in area in supported system | Examining area usage |
Discussion / entry rate | Sales discussions / entries | Auxiliary indicator for commercial interest |
Data accuracy rate | Error relative to reference count | Reliability of reports |
Not all of these indicators are standard outputs of a single people counting sensor.
Especially for regional dwell time, heatmap, and commercial conversion analyses, additional sensors, software, or business data integration may be required.
How Should Sensors Be Mounted in Art Galleries?
The architectural features of art galleries can differ from standard store or office environments.
High ceilings, wide and doorless passages, natural lighting, glass surfaces, and special display arrangements can affect sensor performance.
Additionally, in gallery spaces, technology equipment may be desired to remain as visually unobtrusive as possible.
Mounting Height and Detection Area
The sensor's mounting height and detection width should be within the limits specified by the manufacturer for the respective device.
It should not be assumed that all devices will perform with the same accuracy in galleries with high ceilings.
Entry and Exit Lines
The boundary where people actually enter or exit the gallery should be clearly defined.
Especially individuals approaching the gallery window or pausing at the entrance should not be counted as visitors if they do not actually enter.
Group Passages
During exhibition openings, multiple visitors may enter simultaneously.
Therefore, sensors need to be tested under conditions of group passages, people walking side-by-side, and short-term densities.
Protection of the Exhibition Space
During sensor and cabling work, it is important to:
Avoid interfering with artworks and display equipment.
Preserve the aesthetic integrity of the space.
Avoid unnecessary surface drilling and cabling.
Observe artwork protection and display conditions.
Ensure safe maintenance access after installation.
Especially in areas exhibiting artworks of high collection value, mounting decisions should be evaluated in conjunction with gallery management and artwork conservation officers.
How to Measure People Counting Accuracy in Art Galleries?
For the people counting system to generate reliable reports, accuracy tests should be performed after installation.
The mere operation of the device or the appearance of numbers on the reporting screen does not mean that accurate counting is being performed.
Manual Reference Counting
Actual entry and exit movements are counted independently at specific time intervals.
Then, these are compared with the results of the automatic system.
For example:
Manual entry count: 200.
Automatic entry count: 192.
Absolute counting difference: 8 people.
In this example, the absolute percentage error is:
In contrast, the accuracy for the defined measurement can be expressed as:
This is only the result of the specified example measurement. It does not indicate that the device will provide 96% accuracy under all operating conditions.
Which Scenarios Should Be Tested?
In art galleries, especially the following should be evaluated separately:
Normal visitor entries.
Crowded opening events.
Groups walking together.
Child visitors.
Wheelchair users.
People waiting at the entrance.
The same person returning from the entrance.
Bi-directional simultaneous passages.
Repeated entries by gallery staff.
AXIS's 3D People Counter technical documentation explains that the counting zone needs to be calibrated and validated with manual reference counts after installation.
The manufacturer recommends manually checking at least 100 passages in specific validation procedures.
However, a manufacturer's validation method does not mean that different brands and technologies must use the same acceptance criteria in all projects.
When Should Accuracy Testing Be Repeated?
It may be appropriate to re-check in the following situations:
Changing the sensor location.
Renewing the exhibition layout.
Changing the entrance architecture.
Software or firmware updates.
Significant changes in density profile.
Unusual values observed in system reports.
Regular validation is important for gallery management to be able to rely on long-term visitor reports.
Is RE-ID Necessary in Art Galleries?
RE-ID (Re-Identification) refers to technical approaches in suitable systems for re-matching the same person in different images or at different times.
In art galleries, a visitor exiting and re-entering can create multiple visit movements in standard people counting systems.
However, identifying unique visitors or correlating repeat visits is a different function from basic entry-exit counting.
When considering the use of RE-ID technology, the following should be evaluated:
What data is being processed.
Whether individuals become identifiable.
Matching accuracy.
Data retention period.
Matching time window.
How erroneous matches affect reports.
Obligations under KVKK.
RE-ID is not necessary in every art gallery.
Total visitor traffic and exhibition-based entry counts may be sufficient for most use cases.
If unique visitor or repeat visit analysis is not truly necessary, methods that pose a greater risk of processing personal data should be considered for non-use.
Do People Counting Systems Fall Under KVKK Scope?
The evaluation of people counting systems in art galleries under KVKK depends on the data processed by the device.
For example, merely recording the total entry and exit counts of unidentified individuals is different from processing visitors' images or personal identifiers.
Some systems can process images within the device and only generate aggregated counting data.
In contrast, some solutions can:
Keep image records.
Monitor people's movements.
Process device or user identifiers.
Correlate visitors between different regions.
Send data to a cloud environment.
Therefore, the marketing of a device as merely anonymous people counting does not prove that the system does not process personal data at any stage.
Key Controls from a KVKK Perspective
The nature of the processed data must be determined.
If personal data is processed, an appropriate legal basis must be evaluated.
Necessary disclosure obligations must be fulfilled.
Image records and access authorizations must be restricted.
Retention and destruction periods must be determined.
If cloud services and international data transfers are involved, the relevant conditions must be examined.
The principle of data minimization must be applied.
The Personal Data Protection Authority's guide on disclosure obligations and its statements regarding security cameras are among the primary reference sources for these evaluations.
What to Consider When Choosing a People Counting System for Art Galleries?
The selection of the correct system should be based on the gallery's specific operational needs.
1. Gallery's Physical Structure
A small gallery with a single entrance and a large art center with multiple halls may not require the same sensor architecture.
2. Analysis Need
Will only daily visitor count be measured, or also exhibition-based density, real-time occupancy, and regional dwell time?
These needs should be determined before the project.
3. Sensor Accuracy
Not only the performance declared by the manufacturer but also the counting results in the actual entrance geometry should be examined.
4. Event Density
The impact of dense group passages during exhibition openings on accuracy should be tested.
5. Reporting Features
The system should be able to generate periodic reports related to exhibition start and end dates or offer suitable data export options.
6. Integration
Depending on the need, options for data correlation with event registration systems, gallery management software, or sales reports can be evaluated.
7. Privacy and Data Security
Processing only necessary data, access control, and appropriate data retention policies should be preferred.
8. Calibration and Maintenance
Periodic checks and recalibration, when necessary, should be performed to maintain the data accuracy of the sensors.
Technical Checklist for Art Galleries
The following checks should be performed before project discovery and procurement:
- Have all visitor entrances of the gallery been identified?
- Have exhibition halls and transition points been mapped?
- Have the KPIs to be measured been defined?
- Have the concepts of entry count and unique visitor been differentiated?
- Is the mounting height of the sensors appropriate?
- Have the gallery architecture and artwork display conditions been evaluated?
- Has testing been performed for dense passages during opening events?
- Have hall-based counting and occupancy calculations been verified?
- Is artwork-proximate dwell time analysis truly necessary?
- Have data retention and KVKK requirements been reviewed?
- Has the correlation of reports with exhibition dates been planned?
- Has counting accuracy been tested with manual reference measurement?
- Can sensor failures and data deficiencies be monitored?
- Has a plan for periodic maintenance and re-validation been prepared?
Frequently Asked Questions About People Counting Systems in Art Galleries
What is the purpose of a people counting system in art galleries?
It measures entry and exit movements to the gallery, providing reports on daily visitor traffic, peak hours, exhibition-based usage, and estimated occupancy in suitable systems.
Which people counting technology is suitable for art galleries?
3D people counting sensors, image analytics, infrared, and other suitable detection methods can be evaluated. The most appropriate technology depends on the entrance geometry, visitor density, and reporting needs.
Can the number of attendees at an exhibition opening be measured?
Entry movements can be measured during specific event hours. However, as the same person may enter multiple times, this number may not be the same as the number of unique attendees.
Can it be determined which artworks attract more interest?
With appropriate area analytics, the density and dwell time in areas containing specific artworks can be measured. However, this data does not definitively indicate that the visitor liked the artwork or intends to purchase it.
Does a people counting system increase art sales?
The system can help better evaluate visitor traffic and exhibition performance. However, people counting technology alone cannot guarantee an increase in sales.
Can real-time visitor count be measured in art galleries?
If all relevant entries and exits are measured, estimated real-time occupancy can be obtained using an appropriate calculation method. Its accuracy should be regularly checked.
Can a people counting system be used in small art galleries?
Yes. In small galleries with a single entrance, basic visitor counting may be sufficient. More complex gallery structures may require additional sensors and software.
Does a people counting system have to record camera footage?
No. Some sensors can be configured to generate only counting data. However, the actual image processing and storage features of the device used should be verified.
How is the accuracy of a people counting system in art galleries checked?
The entry and exit results of the automatic system are compared with manual reference counts. It is recommended to perform tests under different visitor densities.
Are art gallery people counting systems different from museum systems?
Basic detection technologies may be similar. However, in commercial art galleries, analytical needs related to exhibition openings, collector discussions, and artwork sales may be more prominent.
Conclusion: Transforming Visitor Data into Meaningful Decisions in Art Galleries
Beyond automatically measuring visitor entries, people counting systems in art galleries can provide data that supports decisions regarding exhibition and space usage.
Comparing exhibition periods, analyzing opening events, monitoring visitor density, and evaluating commercial indicators with appropriate business data are important use cases for these systems.
However, visitor count, unique visitor count, interaction with artworks, and sales conversion are distinct concepts.The primary goal of a successful art gallery visitor analytics project is not just to collect more data, but to obtain reliable and accurately interpretable data.
Therefore, the success of the system is determined by the right sensor technology, appropriate installation, clear KPI definitions, validation under real-world conditions, data security, and sustainable reporting processes.