
What is Visitor Traffic Analysis? How is it Done and Why is it Important?
Visitor traffic analysis supports data-driven management by measuring entries-exits, visitor density, and movement trends in stores, shopping malls, and other physical spaces. We examine 3D people counting, AI-powered visitor analytics, conversion rate, peak hours, heatmaps, repeat visits, accuracy, and KVKK requirements.
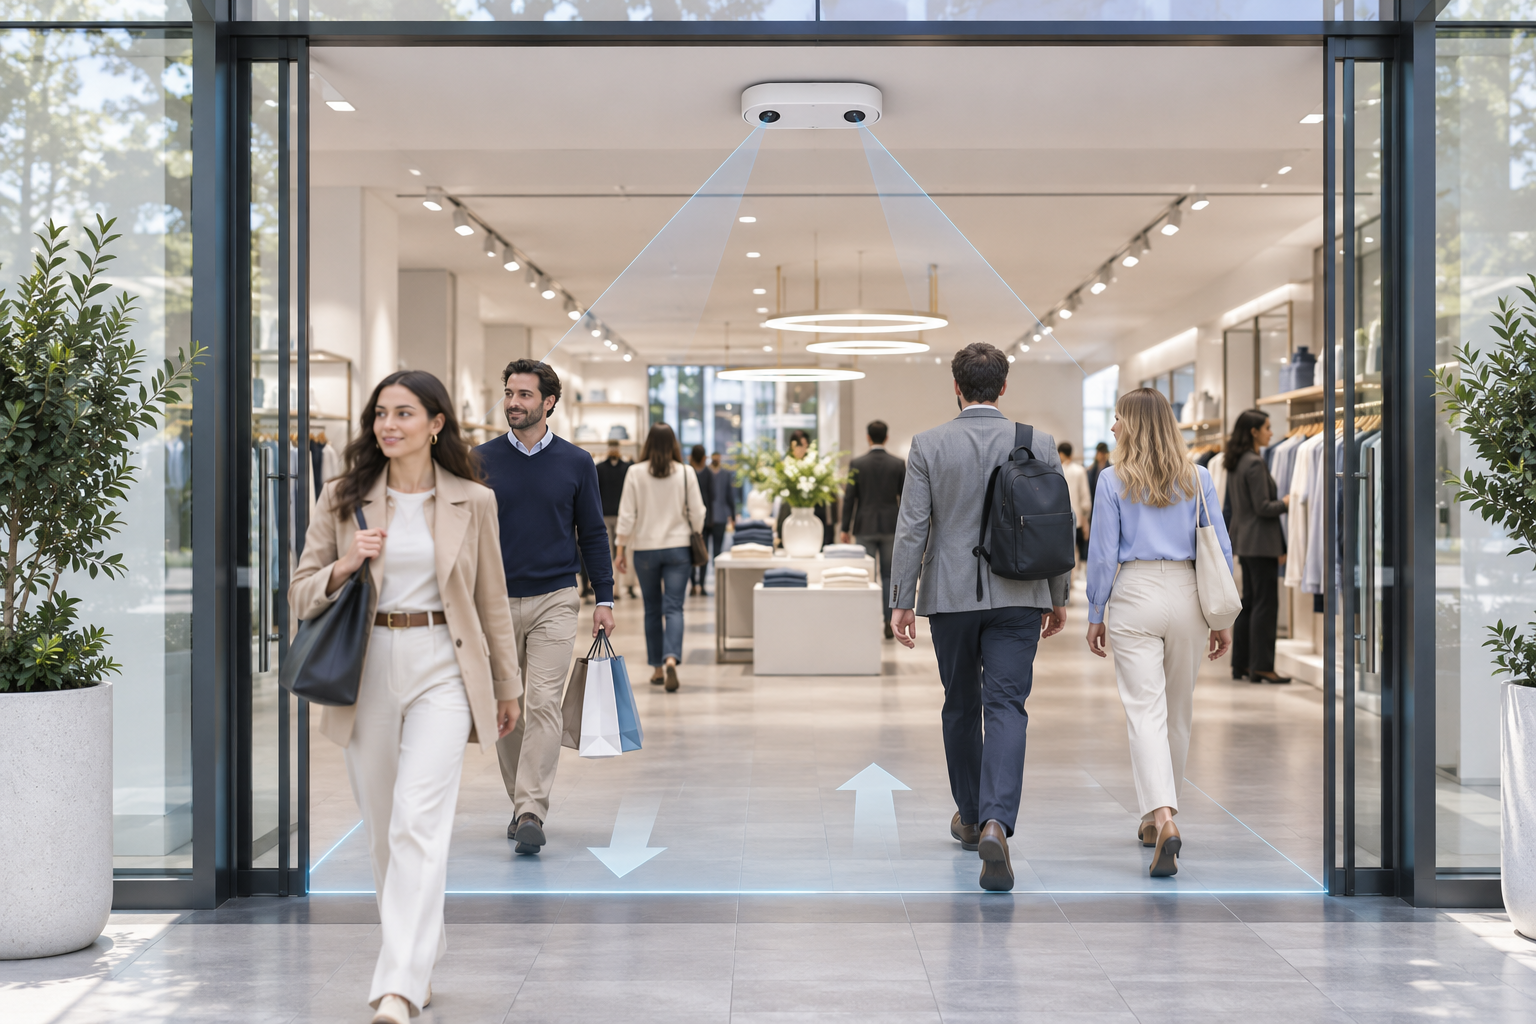
Accurately measuring visitor movement in physical businesses is an important data source for understanding customer behavior and evaluating operational performance. However, assessing the success of a store, shopping mall, or other commercial area solely by sales figures is insufficient. It is also crucial to know how many people visit the business, at what times density occurs, which areas visitors use, and how visitor traffic correlates with commercial outcomes.
Visitor Traffic Analysis is the process of measuring human movements in physical spaces and analyzing data related to entry-exit counts, visitor density, movement trends, and the usage of specific areas.
Using 3D people counting sensors, AI-powered video analytics, and appropriate reporting software, visitor movements can be evaluated over hourly, daily, weekly, or monthly periods.
Visitor traffic analysis can be used in stores, shopping malls, exhibitions, museums, art galleries, airports, and various commercial facilities.
The primary goal of this analysis is not merely to learn how many people arrived, but to transform physical visitor movements into reliable performance indicators that can be used in decision-making processes.
However, visitor traffic, unique visitor count, time spent in-store, and purchasing behavior are distinct concepts. For accurate analysis, these indicators must be clearly defined.
What is Visitor Traffic Analysis?
Visitor traffic analysis is the process of measuring, processing, and interpreting data related to individuals entering, exiting, or moving within defined areas of a specific physical space.
Internationally, these applications are expressed with the following concepts:
Footfall Analytics: Analysis of visitor traffic in physical spaces.
Visitor Traffic Analysis: Evaluation of visitor movement and traffic trends.
People Counting Analytics: Analysis of people counting data.
Retail Traffic Analytics: Measurement of customer traffic in retail stores.
Visitor Flow Analysis: Evaluation of visitor movements and flows in different areas.
Occupancy Analytics: Analysis of estimated people count and occupancy in specific areas.
While these concepts are related, they do not express exactly the same functions.
For example, a basic people counting system can only measure entry and exit movements. More advanced visitor analytics infrastructures, with appropriate sensors and software, can also evaluate indicators such as regional density, waiting time, or commercial conversion.
Visitor traffic analysis is about giving meaning to the raw data produced by the people counting device and correlating it with business performance.
How Does Visitor Traffic Analysis Work?
A typical visitor traffic analytics solution consists of stages: collecting data from sensors, consolidating data on a central platform, and calculating appropriate performance indicators.
1. Detection of Visitor Movements
People counting sensors or suitable analytic cameras are placed at designated entry and exit points.
Devices detect passing individuals and record specific events.
For example:
Entry movement: IN +1
Exit movement: OUT +1
Entry into a zone.
Exit from a zone.
Presence or dwell time in a specific area in supported systems.
2. Generation of Counting Data
Sensors convert detection results into time-stamped counting records.
At this stage, depending on the features of the device used, person and object differentiation, determination of movement direction, or evaluation of group passages can be performed.
3. Central Data Collection
Data from one or more sensors can be transferred to a local server or a suitable cloud-based reporting platform.
Thus, traffic data for different entrances, branches, or regions can be evaluated in a common system.
4. Data Processing
Raw counting data is processed according to time interval, store, region, sensor, and defined operational rules.
For example, staff movements during non-operating hours can be classified separately according to the reporting method determined by the business.
However, for this distinction to be made, the system must use a method that can reliably separate staff and visitor movements.
5. KPI and Reporting
Processed data is converted into different performance indicators.
For example:
Daily visitor entries.
Hourly traffic density.
Traffic change compared to the previous period.
Entry rate from external pedestrian traffic into the store.
Sales transaction / visitor entry rate.
Area utilization density.
Estimated instantaneous occupancy.
Dwell time in specific areas.
6. Supporting Operational Decisions
The results obtained are evaluated in areas such as staff planning, store layout, marketing performance, and visitor experience.
However, the analytical system generating reports alone does not increase business performance. Findings obtained from the data must be supported by appropriate operational decisions.
Difference Between Visitor Count, Entry Count, and Unique Visitor
One of the most common mistakes in visitor analytics is using all counting data with the same meaning.
Entry Count (Footfall IN)
This is the number of entry movements into a physical space within a specific time interval.
A person re-entering can create a new entry event.
Exit Count (Footfall OUT)
This is the number of exit movements from a specific area.
Entry and exit data can be used in appropriate conditions for calculating area occupancy.
Unique Visitor
This is the number of distinct individuals who visited within a defined time interval.
Determining unique visitors is a different technical requirement from standard entry counting.
Returning Visitor
This is an individual identified by an appropriate method as having visited previously within a defined past period.
The matching method and time window used to generate this indicator must be explained.
Example Visitor Counting
In a store within one day:
Visitor | Entry count |
|---|---|
Person A | 2 |
Person B | 1 |
Person C | 3 |
Person D | 1 |
Total | 7 |
In this scenario, four different people made seven entry movements.
Therefore:
Total entry count: 7
Actual number of different people: 4
Repeat entry movements excluding first entries: 3
These data are for illustrative purposes.
Recording seven entries in a standard people counting system does not mean that seven different people visited the store.
This distinction is particularly important for correctly interpreting conversion rate and repeat visit reports.
Key KPIs Measured in Visitor Traffic Analysis
In visitor traffic analysis, evaluating only the total number of visits is not sufficient.
Different performance indicators can be created according to the business's objectives.
KPI | Description | Importance for the business |
|---|---|---|
Footfall IN | Total entry movements | Physical visitor traffic |
Footfall OUT | Total exit movements | Exit and occupancy analysis |
Peak Hour Traffic | Traffic in the busiest hour | Staff and capacity planning |
Traffic Growth | Traffic change compared to previous period | Growth and trend evaluation |
Capture Rate / Turn-in Rate | Rate of entry into the store from external pedestrian traffic | Window display and location performance |
Sales Conversion | Sales transactions / entries | Commercial conversion indicator |
Revenue per Entry | Revenue / entry movements | Commercial efficiency of traffic |
Average Dwell Time | Average time spent in the defined area | Evaluation of area utilization |
Occupancy | Estimated number of people at a specific moment | Density management |
Zone Traffic | Entries or passages into a defined zone | In-store area analytics |
Returning Visitor Rate | Rate of returning visitors in a defined period | Repeat visit trends |
Data Availability | Rate of time when data is completely generated | Report reliability |
Not all of these KPIs are directly obtained from a single people counting sensor.
Especially for commercial conversion, repeat visits, regional dwell time, and sales performance, additional data sources or analytical modules may be required.
How is Visitor Traffic Calculated?
Visitor traffic is generally reported based on the total number of entry movements occurring within a specific time interval.
For example, in a store:
Hour | Entry count |
|---|---|
10.00–11.00 | 65 |
11.00–12.00 | 90 |
12.00–13.00 | 120 |
13.00–14.00 | 145 |
14.00–15.00 | 110 |
Total | 530 |
In this case, a total of 530 entry movements occurred over a five-hour period.
The busiest hour was 13.00–14.00 with 145 entries.
However, this data alone does not indicate that 530 different people visited the store or that 145 people were in the store simultaneously.
How to Calculate Visitor Traffic Growth Rate?
Businesses can evaluate changes in visitor traffic by comparing different periods.
Previous week: 4,000 entries.
This week: 4,600 entries.
then:
it becomes.
In this example, visitor entry traffic increased by 15%.
However, it cannot be said that the increase in traffic is solely due to an advertising campaign.
Weather conditions, public holidays, operating hours, store campaigns, and surrounding events can also affect visitor movement.
Therefore, similar days and operating conditions should be used for comparisons.
External Store Traffic and Entry Rate (Capture Rate)
One of the important uses of visitor traffic analysis in stores is to evaluate how many people passing in front of the store actually enter.
Capture Rate is the ratio of defined external pedestrian traffic that converts into store entry movements.
In this case, the entry rate based on defined external traffic movements is 25%.
However, the number of people passing in front of the store and the passing movement are not the same concept. The same person may have passed in front of the store several times.
Additionally, the corridor covered by the external traffic sensor and the counting scope of the store entrance must be compatible.
This rate can be used as a helpful indicator in evaluating window display layout, store visibility, location, and campaign effectiveness.
However, a high Capture Rate alone does not guarantee more sales.
How to Calculate Sales Conversion Rate with Visitor Traffic?
One of the most important uses of people counting data in the retail sector is the evaluation of sales performance.
Visitor traffic to the store can be compared with transaction data obtained from the POS system.
The commonly used transaction-based conversion formula is as follows:
Example Store Traffic and Sales Analysis
Hypothetical data for a store during a specific period:
Performance indicator | Value |
|---|---|
External pedestrian passes | 8,000 |
Store entries | 2,000 |
Sales transactions | 260 |
Total sales revenue | 780,000 TL |
Capture Rate | %25 |
Transaction / Entry Rate | %13 |
Average transaction amount | 3,000 TL |
Revenue per entry | 390 TL |
The values here do not belong to a real business.
This analysis helps evaluate the relationship between the store's physical traffic and its commercial performance.
However, a 13% transaction/entry rate does not necessarily mean that 13% of visitors made a purchase.
A customer may make multiple transactions. The same person may re-enter the store, or a group of shoppers may complete a single payment transaction.
Therefore, the actual unique customer purchase rate and the operational conversion rate based on transaction count should be defined separately.
For detailed technical information on POS integration, GüvenlikOnline's guide What is a Store Customer Counter? can be reviewed.
Visitor Density and Instant Occupancy Analysis
Visitor traffic analysis can encompass not only the measurement of entries and exits but also the evaluation of how many people are estimated to be in a specific area at the same time.
Occupancy Analytics is the analysis of the occupancy status of a defined physical space.
Estimated occupancy can be calculated with appropriate entry-exit counting as follows:
For example, if 150 entries and 95 exits were recorded in an initially empty store:
150 - 95 = 55 people
This result indicates that approximately 55 people are in the store.
However, for this calculation to be reliable, all relevant entries and exits must be measured.
Error Accumulation in Occupancy Data
Under or overcounting by sensors can accumulate over time.
For example, miscounting a few entries or exits every hour can create a significant difference between estimated occupancy and the actual number of people at the end of the day.
AXIS People Counter technical documentation explains that measurement errors can accumulate over time in occupancy calculations based on simple entry-exit differences.
Therefore:
Initial occupancy must be verified.
All relevant transition points must be measured.
Sensor clocks must be synchronized.
Data interruptions must be monitored.
Counting correction mechanisms should be used where appropriate.
Occupancy validation must be performed under real field conditions.
Important: The estimated occupancy calculated by a people counting system does not replace the capacity determined in the building's regulations or approved fire project. Systems to be used for life safety purposes must also be evaluated for necessary reliability and redundancy conditions.
What is Visitor Flow Analysis?
Visitor flow analysis is the evaluation of how people move between defined transition points or areas.
For example, in a shopping mall, certain corridors may be used more frequently than others.
In a store, visitor traffic in the entrance area can be compared with traffic in areas where product categories are located.
However, measuring the entry count of multiple zones does not mean that visitors' exact movement routes are known.
Different tracking methods may be required to match the same person across areas.
Zone Traffic Analysis
Zone Analytics is the separate evaluation of defined areas.
For example, in a store:
Entrance area.
Women's clothing section.
Men's clothing section.
Accessories area.
Around fitting rooms.
Cashier area.
different traffic indicators can be created.
These analyses can help evaluate store layout and the physical accessibility of product categories.
Heatmap
Heatmaps visually represent the intensity of movement or presence in specific areas.
In appropriate systems, busy areas and less used areas can be compared.
However, not every heatmap represents the same data.
Some systems can visualize passage density, some the number of people in a specific area, and some cumulative dwell time.
A dense appearance of an area on a heatmap does not necessarily mean that products in that area are sold more or are more liked.
What is Dwell Time?
Dwell Time refers to the duration a visitor spends in a defined area.
Two different time concepts are important in visitor traffic analytics.
Total Visit Duration
This is the time elapsed between a person entering and exiting the business.
Direct measurement of this value may require appropriate entry-exit matching or area tracking.
Some systems estimate average visit duration based on total traffic and occupancy data.
Regional Dwell Time
This is the time a visitor spends in a specific product, exhibition, or service area.
This indicator can be useful for understanding area utilization.
However, a person spending a long time near a specific product does not definitively prove an intention to purchase that product.
How to Interpret Average Visit Duration?
A store's average visit duration may have increased from 18 minutes to 24 minutes.
This change could indicate that visitors are examining products for longer, but it could also be related to density, waiting, service delays, or changes in store layout.
Therefore, visit duration should be evaluated in conjunction with visitor feedback, checkout waiting times, and commercial indicators.
RE-ID and Repeat Visit Analysis
One of the advanced applications of visitor traffic analytics is the evaluation of repeat visits under specific conditions.
RE-ID (Re-Identification) is a matching technology that aims to evaluate whether individuals detected at different times or in different images are the same person.
In appropriate systems:
Short-term repeat entries.
Visitor movements between specific areas.
Unique visitor estimations.
Certain repeat visit patterns.
can be analyzed.
However, it should not be assumed that all RE-ID-enabled devices can recognize a person returning an hour, a day, or a week later.
Appearance-based algorithms can be affected by camera perspective, clothing changes, matching threshold, and time window.
Furthermore, correlating device signals via Wi-Fi/BLE is not the same technology as image-based RE-ID.
Therefore, the data type, matching method, accuracy, and data retention period used in repeat visit analysis must be clearly stated by the manufacturer.
Technologies Used in Visitor Traffic Analysis
Different sensor technologies can be used to measure visitor traffic.
3D People Counting Sensors
3D people counting sensors can utilize stereo imaging or other depth sensing methods.
Suitable models can be used specifically for determining movement direction at entries and exits and for differentiating people passing side-by-side.
However, it should not be assumed that every 3D sensor has the same accuracy, mounting height, or crowd performance.
AI-Powered Video Analytics
AI-powered IP cameras and video analytics software can evaluate individuals passing defined counting lines or people present in specific areas.
Solutions like AXIS Object Analytics offer analytical scenarios such as line crossing, regional occupancy, and dwell time in specific areas on supported cameras.
However, a standard CCTV camera's ability to detect humans does not automatically mean it provides high-accuracy visitor counting functionality.
For more information, GüvenlikOnline's guide Video Analytics Systems can be reviewed.
Infrared People Counting
Infrared beam-based systems can be used for detecting people passing a specific line.
They can be an option for narrow and controlled passages.
However, people walking side-by-side, group passages, and waiting behaviors can affect system accuracy.
Thermal People Counting
Thermal sensors can be used for detecting people by utilizing differences in infrared energy.
In certain applications, they can help with counting without generating a visible light image.
However, ambient temperature, human density, and sensor resolution must be considered.
mmWave Radar Technology
mmWave radar systems can be used in suitable devices for human presence and motion detection.
However, presence detection and high-density directional people counting are different technical requirements.
Comparison of Sensor Technologies
Technology | Prominent use | Key limitation |
|---|---|---|
3D stereo people counting | Entry-exit and suitable crowd passages | Mounting geometry, overlap |
ToF depth sensor | Depth-based counting in suitable areas | Range and environmental conditions |
AI video analytics | Counting, area, and motion analysis | Camera angle, algorithm, privacy |
IR beam sensor | Narrow passages | Side-by-side group passages |
Thermal sensor | Specific presence and people counting | Thermal contrast and resolution |
mmWave radar | Presence and suitable motion analysis | Multiple person differentiation, device-specific capacity |
The correct technology should be chosen not based on the sensor's highest accuracy rate in the catalog, but on its verified performance in the actual measurement area.
Central Visitor Traffic Reporting System
In projects with multiple stores or facilities, consolidating visitor traffic data on a central platform is important.
A central reporting infrastructure can offer the following functions in suitable systems:
Branch-based traffic reports.
Hourly, daily, weekly, and monthly comparisons.
Zone and floor-based density analysis.
External and internal store traffic comparisons.
POS integration.
Filtering according to business operating hours.
Comparison of campaign periods.
Monitoring the online status of sensors.
Data export and API connections.
Role-based user authorization.
However, the central software offering advanced reports does not mean that the sensors used can measure all data.
For example, if only entry and exit counts are obtained from a standard entry sensor, the software alone cannot create actual customer movement routes.
Why is Data Integrity Important in Visitor Traffic Analysis?
The reliability of visitor analytics reports depends on the correct functioning of measurement devices and the data collection infrastructure.
Especially in chain retail and shopping mall projects, not only the counting results but also the conditions under which the data was produced and whether it was received completely should be monitored.
Sensor Connection Status
Loss of network connection or the device going offline can lead to data gaps during certain periods.
Time Synchronization
Data from multiple sensors must be recorded with the same time reference.
Differences in time settings can make hourly traffic and POS comparisons inaccurate.
Offline Data Storage
Suitable devices can temporarily store data during connection interruptions.
However, this capacity is not the same for every device.
Buffer overflow or power outages can lead to different record losses.
Reporting Missing Data
For example, if the people counting sensor in a store did not operate for four hours during a day, that day's data should not be evaluated as full-day traffic.
Reporting missing hours as zero visits can lead to incorrect results.
Data Quality Indicators
The following indicators can be used to evaluate system reliability:
Sensor uptime.
Data transfer success rate.
Missing record intervals.
Counting accuracy results.
Last calibration date.
Firmware version.
Time synchronization status.
Open fault or maintenance records.
These indicators help ensure that the people counting system is not just a data generator, but an operational infrastructure whose measurement quality can be audited.
How is Visitor Traffic Analysis Accuracy Measured?
The fundamental factor determining the accuracy of reports in visitor analytics is how well the counting results align with actual field passages.
A device generating data or displaying numbers on a reporting screen does not mean it is measuring accurately.
Manual Reference Count
The sensor's entry and exit data can be compared with independent manual counts at specific time intervals.
For example:
Manual reference count: 400 entries.
Automatic system: 390 entries.
Absolute difference: 10 entries.
In this case, the absolute percentage error is calculated as:
Simplified counting compliance based on totals can be expressed as 97.5%.
However, this result does not mean that the system counts every person correctly with 97.5% probability.
Missing some individuals and overcounting others can partially balance each other out.
Therefore, miscounted and missed passages should be evaluated separately whenever possible.
Under What Conditions Should Validation Be Performed?
At low and high visitor densities.
During side-by-side and group passages.
During simultaneous entries and exits.
With people waiting at the entrance.
With visitors who turn back and exit.
With children and people of different heights.
With shopping carts, bags, and other objects.
Under different lighting conditions.
In situations where the entrance architecture changes.
AXIS People Counter technical documentation recommends performing manual validation over at least 100 passages after installation for relevant devices.
However, this number is not a universal requirement for all manufacturers and projects.
Field acceptance criteria should be determined based on expected visitor density and the purpose of the measurement.
Difference Between Accuracy, Calibration, and Validation
Accuracy: Expresses how close measurement results are to actual reference values.
Calibration / adjustment: May involve adjusting the sensor's detection area and relevant parameters to improve performance.
Validation: Is the verification that the system provides the required measurement performance under defined operating conditions.
In retail projects, validation should be performed when the system is first installed and repeated after significant changes.
Benefits of Visitor Traffic Analysis for Businesses
Staff Planning
Identifying peak hours can help evaluate the working hours of service personnel.
However, the required number of staff should not be calculated solely based on visitor entries. Transaction times and service needs must also be considered.
Marketing Campaign Analysis
Traffic changes before and after campaigns can be compared.
However, to understand the true impact of a campaign on traffic, similar days, control stores, or appropriate experimental evaluation methods can be used.
Store Layout Improvement
Regional density and passage data can assist in product placement and directional decisions.
Conversion Rate Evaluation
By comparing visitor traffic and POS transaction counts, the store's commercial output per traffic can be examined.
Branch Performance Comparison
Traffic, conversion, and revenue indicators of different stores can be evaluated together.
However, factors such as operating hours, location, store size, season, and data gaps must be considered in comparisons.
Customer Experience Evaluation
Operational improvements can be planned by identifying heavy use of certain areas and queues.
However, density data is not a direct measure of customer satisfaction.
In Which Areas is Visitor Traffic Analysis Used?
Retail Stores
Can be used to evaluate store entry traffic, peak hours, sales conversion, and the use of specific product areas.
Shopping Malls
Visitor movements at main mall entrances, floors, and specific common areas can be measured.
Chain Stores
Traffic and commercial performance indicators of different branches can be compared on a central platform.
Exhibition and Convention Centers
In exhibition areas, hall entries, event density, and traffic around stands can be examined with appropriate analytical systems.
Museums and Art Galleries
Visitor movements, exhibition periods, and the intensity of use of specific areas can be analyzed.
Airports and Transportation Hubs
Terminal entries, passenger flow, and the density of specific service points can be evaluated.
Hospitals and Public Buildings
Aggregate mobility data related to waiting areas, information desks, and common use areas can be generated.
In these applications, personal data and specific privacy requirements must be examined separately.
KVKK and Privacy in Visitor Traffic Analysis
The status of visitor analytics systems under KVKK depends on what data the technology used processes.
For example, storing only unidentified aggregate entry counts is not the same data processing activity as processing individuals' images or identifiers that can be linked across different visits.
Some devices can process images internally and only transmit counting results.
Other systems, however, can:
Record camera images.
Track individuals in specific areas.
Correlate different observations.
Process Wi-Fi or Bluetooth device identifiers.
Send data to cloud systems.
Therefore, a manufacturer's designation of a system as anonymous people counting does not automatically prove that no personal data is present at all data processing stages of the system.
The Personal Data Protection Authority's statements regarding the use of security cameras in workplaces emphasize the importance of data minimization, purpose limitation, employee privacy, retention period, and access security.
Key Controls from a KVKK Perspective
The types of data processed must be determined.
If personal data is processed, an appropriate legal basis must be evaluated.
Necessary disclosure obligations must be fulfilled.
Storage of unnecessary images and identifiers should be avoided.
User access permissions must be restricted.
A data retention and destruction policy must be created for the data.
Cloud services and international data transfer conditions must be examined.
The necessity of additional functions such as RE-ID and individual movement tracking must be evaluated separately.
Specifically, using a system installed for visitor counting to subject employees to continuous performance monitoring requires a separate purpose and legal evaluation.
What to Consider When Choosing a Visitor Traffic Analysis System?
In a professional visitor analytics project, the selection of the right technology should not be based solely on sensor price or catalog accuracy.
Selection criterion | Topic to be evaluated |
|---|---|
Measurement purpose | Entry, occupancy, regional traffic, conversion |
Sensor technology | 3D, AI, thermal, or other methods |
Mounting conditions | Height, entrance width, angle |
Traffic density | Group and simultaneous passage performance |
Multiple entries | Central consolidation of sensors |
Data accuracy | Field validation with manual counts |
Software | KPI, reporting, and export |
Integration | POS, CRM, and suitable third-party systems |
Data continuity | Offline buffer and connection tracking |
Operational management | Fault, calibration, and maintenance records |
Cybersecurity | User permissions and network access |
KVKK | Processed data, purpose, and retention conditions |
Additionally, if the project plans to include different branches or areas in the system in the future, software and hardware expansion capacity should be evaluated.
Visitor Traffic Analysis Technical Checklist
The following checks should be performed during the installation and commissioning phases:
- Are the measurement purpose and required KPIs defined?
- Are all relevant entries and exits identified?
- Is external pedestrian traffic differentiated from store entry traffic?
- Are the sensor mounting height and field of view appropriate?
- Has a counting test been performed for dense group passages?
- Is the reporting logic clear for cases where the same person re-enters?
- Are the concepts of unique visitor and entry movement differentiated?
- Has it been determined how staff movements will be evaluated?
- Are the initial and boundary conditions for occupancy calculation defined?
- Is the need for regional analytics and heatmaps determined?
- Are transaction definitions and times compatible in POS integration?
- Has the central reporting system been verified?
- Has data loss during network or power outages been tested?
- Are sensor uptime and data availability rates monitored?
- Has validation been performed with manual reference counts?
- Have KVKK and relevant data processing conditions been evaluated?
- Has a periodic maintenance and re-validation plan been created?
Frequently Asked Questions About Visitor Traffic Analysis
What is visitor traffic analysis?
It is an analytical process that measures and reports human entries, exits, and, in appropriate systems, area utilization and movement trends in physical spaces.
What is visitor traffic analysis used for?
It helps in determining peak hours, staff planning, evaluating marketing results, examining area utilization, and calculating commercial conversion rates in suitable businesses.
How is visitor traffic analysis performed?
Data obtained from people counting sensors is collected in central software, verified, and analyzed according to defined KPIs.
Are people counting and visitor traffic analysis the same?
No. People counting is the measurement of passage movements. Visitor traffic analysis, on the other hand, is the evaluation of these measurements together with trends, operations, and other business data.
What does Footfall Analytics mean?
Footfall Analytics refers to the measurement and analysis of visitor or pedestrian traffic in physical spaces.
How is the conversion rate calculated in visitor traffic analysis?
The common transaction-based method in retail is dividing the number of sales transactions by the number of store entries. However, this rate may not be the same as the unique customer purchase rate.
Can people passing outside the store be measured?
With appropriate sensor placement and technology, pedestrian traffic in front of the store can be measured. This data can be compared with store entries to calculate the Capture Rate.
Can repeat visitors be identified?
Certain repeat visit analyses can be performed with appropriate RE-ID or other correlation technologies. However, not all people counting devices support this function.
Can visitor traffic analysis be done with existing cameras?
Some applications can be performed with supported IP cameras and analytical software. However, the presence of standard CCTV footage does not guarantee reliable people counting functionality.
Does visitor traffic analysis increase sales?
It can support better decision-making. However, this technology alone does not guarantee increased sales or a specific return on investment.
Is visitor traffic analysis compliant with KVKK?
Legal compliance depends on the type of data processed by the system used and the technical and administrative measures implemented. Systems processing personal data must be evaluated separately.
Conclusion: Transforming Visitor Traffic into Measurable Business Performance
Visitor traffic analysis measures human mobility in physical spaces, enabling businesses to gain more detailed insights into visitor density, area utilization, and operational performance.
Data obtained from people counting sensors can be used for purposes such as determining peak hours, comparing external traffic with store entries, analyzing conversion rates, and evaluating different branches.
However, visitor traffic, unique visitors, repeat visits, and purchasing behavior are distinct indicators.
In a successful visitor traffic analytics project, accurate KPI definitions, appropriate sensor placement, system integration, and continuous validation of data quality are important.
The true value of visitor traffic analysis is not just showing how many people arrived; it is helping businesses make more accurate decisions through reliable data.