
What Is Retail Visitor Analytics? Store Performance, KPIs and Customer Traffic Analysis
Retail visitor analytics is a data-analysis approach that evaluates business performance by measuring customer movements from store entrances to aisles and points of sale. We examine KPIs such as visitor traffic, store entry rate, sales conversion, aisle engagement, peak hours and visit duration alongside people-counting technologies, POS integration, data accuracy and KVKK requirements.
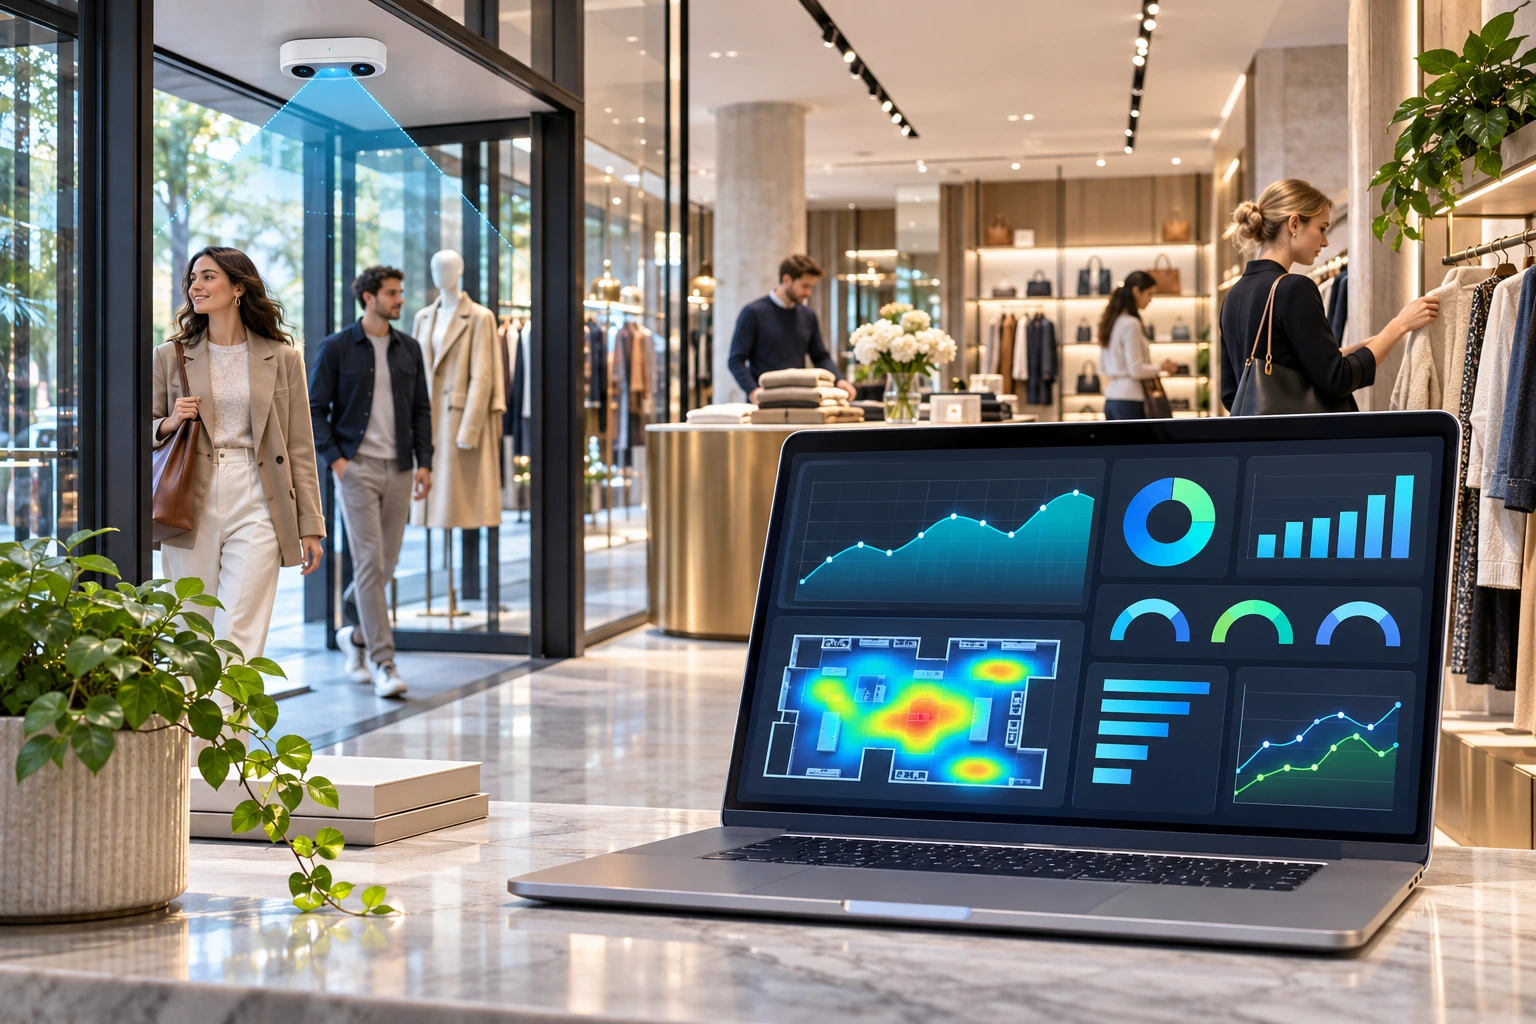
Retail visitor analytics encompasses the technologies and data-processing methods used to analyze the number of visitors to physical stores, their movements inside the store, the areas that attract their interest, and how these movements relate to sales performance.
Traditional store management uses sales revenue, units sold and transaction count as key performance indicators, while visitor analytics adds customer traffic to these data. This allows businesses to examine not only how much they sell, but also how effectively they capitalize on their existing visitor potential.
Visitor analytics can be used especially in chain stores, shopping malls, supermarkets, fashion retailers and large commercial businesses to compare store performance, plan staffing, assess marketing activities and improve customer experience.
The primary aim of retail visitor analytics is not merely to find out how many people enter a store, but to link visitor movements to measurable business outcomes so that more accurate operational and commercial decisions can be made.
What Is Retail Visitor Analytics?
Retail visitor analytics is an analytical approach that measures and classifies visitor movements in physical retail spaces and evaluates them in terms of business performance.
In the international retail technology industry, terms such as Retail Analytics, Footfall Analytics, Shopper Analytics, In-Store Analytics and Retail Traffic Intelligence are used.
Although these terms are related, they do not describe exactly the same scope.
For example, people-counting systems primarily measure store entries and exits, whereas advanced visitor analytics solutions can also assess people passing in front of a store, visitors heading to specific aisles, occupancy in different areas, and—when suitable data sources are available—sales conversion rates.
The Difference Between People Counting and Visitor Analytics
People counting is one of the primary data sources for visitor analytics.
However, the raw data provided by people-counting systems may not, on its own, explain visitor behavior or business outcomes.
| Feature | People counting | Visitor analytics |
|---|---|---|
| Number of store entries | Yes | Yes |
| Entry-exit direction | On supported devices | Yes |
| Peak-hour analysis | With basic reports | With operational comparisons |
| Aisle engagement | Additional sensors may be required | With suitable analytics systems |
| Visit duration | Additional measurement is generally required | On supported systems |
| Sales conversion rate | With POS integration | One of the key business KPIs |
| Store comparison | By traffic | By traffic, sales and operations |
The key distinction is what data the system actually measures. One should not assume that a standard entrance sensor can provide aisle-interest analysis or a true count of unique visitors.
How Does Retail Visitor Analytics Work?
Retail visitor analytics generally operates through sensors, data-communications infrastructure, analytics software and the business's other information systems.
The process can be viewed as four main stages.
1. Measuring Visitor Movements
Sensors installed at store entrances, in front of display windows or in designated interior areas generate data on visitor movements.
Depending on the technology used, the number and direction of entries and exits, area occupancy or time spent in specific areas can be measured.
2. Transferring Data to a Central Platform
Data generated by sensors is transferred to a local server, a cloud-based platform or a hybrid analytics infrastructure.
At this stage, the store, door, area and time period to which the data relates must be identified correctly.
3. Processing Visitor Data
The software processes the data according to specified reporting rules.
Daily visitor totals, changes over time, peak hours and other performance indicators can be generated.
More comprehensive analyses can be carried out when the system is integrated with POS, ERP or staff-planning systems.
4. Creating Management Reports
The results are presented on dashboard screens, in periodic reports or on business intelligence platforms.
This enables store managers, regional managers and head-office management to assess business performance at different levels.
Which KPIs Are Measured in Retail Visitor Analytics?
The core value retail visitor analytics offers businesses lies in turning measured data into meaningful performance indicators.
1. Store Visitor Traffic (Footfall)
Footfall refers to visitor movements measured over a specific period.
People-counting sensors used at store entrances can report hourly, daily, weekly and monthly visitor traffic.
Visitor traffic is a key indicator for assessing a store's potential to attract customers in person.
However, if a person enters the same store several times in one day, standard systems may count each entry as a separate entry event.
Therefore, the number of entries should not be confused with the number of unique visitors.
2. Store Entry Rate (Capture Rate / Turn-In Rate)
The store entry rate indicates what proportion of people passing in front of a store enter it.
Store entry rate (%) = Number of visitors entering the store / Total number of people passing in front of the store × 100
Example:
Suppose 10,000 people passed in front of a store in one day, and 2,000 of them entered the store.
Store entry rate:
2000 / 10000 × 100 = %20
This result shows that 20% of the measured external traffic converted into store entries.
The store entry rate can be used especially to assess window displays, campaign visibility, store location and storefront performance.
However, this rate cannot be calculated from store entry counts alone without actual external traffic data. The tendency of the external traffic measurement area to count the same person more than once must also be taken into account.
3. Sales Conversion Rate
The sales conversion rate is one of the key retail KPIs showing the relationship between visitor traffic and sales transactions.
Common transaction-based calculation:
Sales conversion rate (%) = Number of sales transactions / Number of store entries × 100
Example:
If 2,000 visitors enter a store in a day and 300 sales transactions take place during the same period:
300 / 2000 × 100 = %15
The store's transaction-based sales conversion rate is 15%.
However, the number of sales transactions may not be the same as the number of unique customers who make a purchase.
A visitor may make multiple transactions, or a single shopping transaction may involve more than one person.
Therefore, the calculation method and data definitions used must be consistent across all stores.
4. Sales per Visitor
Sales per visitor is calculated by comparing total sales revenue with measured visitor traffic.
Sales per visitor = Net sales revenue / Number of store entries
For example, sales per visitor at a business with daily net sales revenue of TRY 450,000 and 2,000 store entries would be:
450000 / 2000 = 225 TL
This indicator helps assess the relationship between a store's visitor potential and its commercial results.
However, directly comparing stores operating in different price categories may be misleading.
5. Average Transaction Value
Average transaction value is calculated by dividing total sales revenue by the number of sales transactions.
Average transaction value = Net sales revenue / Number of sales transactions
This indicator is not obtained directly from a visitor-counting sensor. Data from the POS or relevant sales system is required.
Assessing it alongside the conversion rate makes it easier to determine whether a change in sales performance stems from the number of transactions or the average transaction value.
6. Visit Duration (Dwell Time)
Dwell time refers to the time a visitor spends in a designated area or zone.
In retail, it can be assessed for in-store aisles, product-experience areas and specific commercial zones.
For example, a technology store can analyze how long visitors who enter the phone-experience area spend there.
However, a person spending a long time in a particular area does not definitively indicate a strong intention to purchase.
The relationship between visit duration and sales needs to be assessed separately.
7. Aisle Engagement Rate
The aisle engagement rate shows the proportion of visitors who interact with a specified product or aisle according to the defined measurement rules.
In some analytics systems, this is calculated by counting people who remain in an area for longer than a specified period.
However, the definition of engagement can vary from one vendor to another.
For a detailed assessment of aisle performance, see GüvenlikOnline's What Is Aisle Visitor Analysis? article.
8. Peak-Hour Analysis
Peak-hour analysis identifies the times of day when a store records its highest visitor traffic.
This data can be used for:
Planning staff shifts.
Assessing checkout capacity.
Improving customer service processes.
Comparing campaign timings.
purposes.
However, a high visitor count alone does not determine how much staffing should be increased. Other variables, such as service times and transaction volume, must also be examined.
Example: How Is Store Performance Measured with Retail Visitor Analytics?
Let's examine the daily performance of a fashion store using the example data below.
| Measured data or KPI | Example result |
|---|---|
| People passing in front of the store | 10000 |
| Store entries | 2000 |
| Number of sales transactions | 300 |
| Net sales revenue | 450000 TL |
| Store entry rate | %20 |
| Sales conversion rate | %15 |
| Sales per visitor | 225 TL |
| Average sales transaction | 1500 TL |
These values are hypothetical data created to illustrate the calculation method; they are not measurement results from an actual store.
In this example, the store's performance is not assessed solely on the basis of revenue of TRY 450,000.
Management can examine the following questions:
What proportion of people passing in front of the store enter it?
What proportion of those entering the store complete a sales transaction?
Is poor performance due to insufficient visitor traffic?
Why is sales conversion low when visitor numbers are high?
Are staffing and checkout capacity adequate during the busiest hours?
This approach makes visible not only the sales outcome but also the physical visitor journey leading to the sale.
What Benefits Does Retail Visitor Analytics Offer Stores?
Evaluating Sales Opportunities
Visitor analytics can help identify differences between a store’s customer traffic and its sales performance.
For example, two stores generating the same revenue does not mean they have the same operational performance.
One store may achieve a high conversion rate with lower visitor traffic, while another may have a low conversion rate despite higher visitor traffic.
These differences can indicate which issues management should examine at each store.
Improving Staff Planning
Hourly visitor data can be used to assess staffing capacity throughout operating hours.
Especially during peak periods, customer-service capacity, checkout waiting times, and the availability of sales associates can be examined together.
However, there is no fixed ratio between an increase in visitor numbers and staffing needs that applies to every business.
Measuring Storefront and Campaign Performance
When pedestrian traffic outside a store and the number of store entries are measured together, entry rates before and after changes to the storefront or a campaign can be compared.
However, seasonality, the day, weather conditions, and other effects should be assessed before concluding that an increase in visitors was caused solely by a campaign.
Assessing Store Layout
Advanced analytics solutions can show how visitors are distributed across specific areas within a store.
For example, finding low engagement in certain departments despite high visitor traffic may prompt a reassessment of product placement or the wayfinding layout.
Comparing Branch Performance
In chain retailers, comparing stores under the same brand solely by sales figures can lead to misleading interpretations.
Visitor traffic, sales conversion, store size, operating period, and commercial location should be assessed together across different stores.
What Technologies Are Used in Retail Visitor Analytics?
Retail analytics is a field in which different measurement technologies can work together.
3D Stereo People-Counting Sensors
People-counting sensors using stereo imaging can use depth information to detect movement in the entry and exit directions.
Under suitable installation conditions, they can be used to count visitors at store entrances.
ToF and Depth Sensors
Time-of-Flight (ToF) is a technology for obtaining distance or depth information from the time taken by light to travel to and return from an object.
Suitable products can be used to detect people and measure movement in an area.
AI-Powered Video Analytics
AI video analytics solutions can analyze human movement in specific areas using supported cameras and processing infrastructure.
Depending on the use case, metrics such as visitor counts, area occupancy, queues, and direction of movement can be generated.
However, it should not be assumed that all AI-powered cameras offer the same measurement capabilities.
Heatmaps
Heatmaps are visual analytics displays showing the usage or movement intensity of specific areas.
Some systems use colors to show zone-based counts, while others can create more detailed density maps from visitor movements.
Therefore, not every heatmap uses the same data source or measurement method.
RE-ID and Repeat-Visit Analysis
RE-ID technologies aim to rematch visitors detected at different times or locations in suitable systems.
These methods can be used to analyze repeat entries or specific relationships between visits.
However, matching errors, the time window used, and personal-data processing requirements should be taken into account.
The technical details of this topic are explained in the What Is RE-ID? Repeat-Visit Analysis and People Counting article.
Why Is Data Accuracy Important in Retail Visitor Analytics?
The reliability of KPIs generated through visitor analytics depends on the accuracy of the underlying measurements.
For example, in a store where the actual number of visitors is 1,000, the sensor reports 900 entries, and 120 sales transactions take place, the software will show the transaction-based conversion rate as:
120 / 900 × 100 = %13.33
as.
Using the actual number of entries, the same calculation:
120 / 1000 × 100 = %12
is.
In this example, the sensor’s undercount caused the conversion rate to appear higher than it actually was.
Therefore, inaccurate visitor data affects not only visitor reports but also other metrics used to assess sales performance.
The Difference Between Measurement Accuracy and Data Integrity
Two separate checks are required:
Measurement accuracy: Whether sensors accurately count actual people passing through.
Data integrity: Whether measured entry and exit data is transferred to the software accurately, completely, and without duplication.
The following should be checked:
Sensor mounting height and angle.
Counting lines and detection zones.
Entry and exit directions.
Side-by-side crossings and high-traffic conditions.
Door and store mappings.
Sensor connection outages.
Time synchronization.
Duplicate or missing data records.
must be checked.
For data quality assessments, ISO/IEC 25012:2008 provides a model that can be consulted for general data quality characteristics such as accuracy and completeness. However, this standard does not specify a mandatory counting-accuracy percentage for retail visitor analytics sensors.
For accuracy measurement, calibration, and validation processes in people-counting systems, the guide Periodic Maintenance Standards for People-Counting Systems can be consulted.
Retail Visitor Analytics Integration with POS and ERP
Retail visitor analytics can provide more comprehensive analyses when combined with sales and operational data.
POS Integration
Sales transaction counts and revenue data from POS systems can be combined with people-counting data to calculate sales conversion rates and revenue per visitor.
During integration, matters such as store codes, time intervals, and the reporting approach for returns and cancellations must be defined consistently.
ERP and Business Intelligence Integration
Visitor data transferred to ERP or business intelligence platforms can be assessed alongside information such as store sales, staff planning, and inventory management.
However, the mere transfer of data does not guarantee that the resulting KPIs are calculated correctly.
The data schema, time matching, report calculations, and error handling should be tested separately.
Which Stores Use Retail Visitor Analytics?
Visitor analytics can serve different business purposes across different retail sectors.
| Retail type | Primary analysis |
|---|---|
| Fashion and clothing stores | Storefront, entry, and sales conversion |
| Electronics stores | Product experience areas and department interest |
| Supermarkets | Peak hours, checkout, and queue performance |
| Furniture stores | Visit duration and area interest |
| Cosmetics stores | Department engagement and sales performance |
| Luxury retail | Service capacity and visitor experience |
| Shopping malls and complexes | Overall traffic, and density by floor and area |
Nevertheless, the same analytical metric should not be assumed to have the same commercial meaning across all retail sectors.
For example, a long visit duration may be associated with detailed product evaluation in a furniture store, but may indicate a long wait in a supermarket.
Retail Visitor Analytics and KVKK
Whether retail analytics systems process personal data depends on the technology used and the data-processing architecture.
A system that stores only aggregate entry and exit counts that cannot be linked to individuals does not have the same data protection risks as a system that processes images, movement sequences, or device identifiers.
The following matters should be assessed in particular:
Whether camera footage is processed.
Whether footage is stored.
Whether visitors are linked across different areas.
Use of RE-ID or other people-matching methods.
Processing of Wi-Fi or Bluetooth identifiers.
Transfer of personal data to cloud systems.
Data retention and deletion policies.
Preventing unauthorized access.
Describing an analytics system as anonymous does not automatically prove that no personal data is present at every stage of data processing.
Where personal data is processed, the legal basis, the obligation to provide information, data minimization, and security measures should be assessed.
If personal data is to be transferred abroad, the conditions in Article 9 of Law No. 6698 should also be examined.
For more information, the article People-Counting Systems Compliant with KVKK can be consulted.
What Should You Consider When Choosing a Retail Visitor Analytics System?
The right solution should be selected after determining the KPIs and measurement conditions the business needs.
Technical Selection Criteria
Measurement scope: Which areas will be measured, such as the store entrance, external traffic, departments, and queues?
Sensor accuracy: Can the technology used be validated under real-world site conditions?
KPI definitions: Are the calculation methods for sales conversion, entry rate, and engagement metrics clearly defined?
Software infrastructure: Is a cloud, on-premises, or hybrid setup suitable for the business?
Integration: Is connectivity with POS, ERP, and other data sources supported?
Multi-branch management: Can reports be created by region, store, and department?
Data integrity: Can missing data, connection errors, and duplicate records be managed?
Maintenance and support: Are calibration, validation, and update processes defined?
Data security: Are KVKK and access-authorization requirements met?
These criteria should be evaluated not only on the basis of product catalogs but also through real-world site tests and sample reports.
Retail Visitor Analytics Installation Checklist
Have the business KPIs to be analyzed been defined?
Have all store entrances and relevant measurement zones been defined?
If external traffic measurement is required, has a separate sensor been planned?
Has sensor accuracy been validated under real-world site conditions?
Has the impact of staff and repeat entries on the count been assessed?
Have store operating hours and time zones been checked?
Have POS and people-counting data been matched over the same time interval?
Have the KPI formulas in the reports been validated?
Have missing-data and connection-outage alerts been tested?
Have authorization, retention, and KVKK requirements been assessed?
Has the accuracy of management reports been checked using sample data?
Has a periodic calibration and validation plan been established?
This checklist is intended for preliminary assessment. The final technical design and acceptance criteria for the system should be determined according to the project’s needs.
Frequently Asked Questions About Retail Visitor Analytics
What is retail visitor analytics?
Retail visitor analytics is a data-analysis approach that measures the movements and densities of visitors to physical stores and, in suitable systems, their interactions with specific areas, and evaluates these in terms of business performance.
Is people counting the same as retail visitor analytics?
No. People counting is one of the core data sources for visitor analytics. Visitor analytics can combine count data with sales, operations, and other relevant measurements to produce more comprehensive indicators.
Does retail visitor analytics increase sales?
Accurate visitor data can help identify sales opportunities and improve operational decisions. However, implementing an analytics system alone does not guarantee an increase in sales.
How is the sales conversion rate calculated?
In the commonly used transaction-based calculation, the number of sales transactions is divided by the number of store entries and multiplied by 100. This rate should not be confused with the proportion of unique buyers.
Can the number of people passing a store be measured?
Pedestrian traffic in front of a store can be measured using suitable sensors and measurement zones. This data can be assessed alongside store-entry counts to calculate the store-entry rate.
Does visitor analytics identify customer identities?
Standard people-counting applications do not require customer identities to be determined. However, advanced systems that use RE-ID or other identifiers may create different personal-data processing risks.
Can retail visitor analytics be cloud-based?
Yes. Cloud-based software can enable visitor data from different stores to be reported centrally. On-premises and hybrid software architectures can also be used.
Conclusion: Why Is Retail Visitor Analytics Important?
Retail visitor analytics helps physical stores adopt a more measurable management approach by linking visitor traffic with business performance.
When the number of people passing in front of a store, the store-entry rate, sales conversion, revenue per visitor, peak hours, and—in suitable systems—department interactions are assessed together, businesses can identify different areas for improvement.
However, achieving successful results with visitor analytics requires more than simply using advanced sensors or reporting software.
Reliable retail analytics is built on accurate measurement, consistent KPI definitions, data integrity, appropriate integration, and regular validation.
Retail businesses can use visitor analytics not only to report on past performance, but also to assess store operations, improve the customer experience, and base business decisions on more robust data.