
What is Checkout Queue Analytics? Wait Time and Cashier Management
Checkout queue analytics supports operations management by measuring queue length, wait time, and checkout service capacity in stores and supermarkets. We examine 3D people counting sensors, AI-powered queue analysis, automatic checkout opening alerts, POS integration, accuracy measurement, and correct system selection criteria.
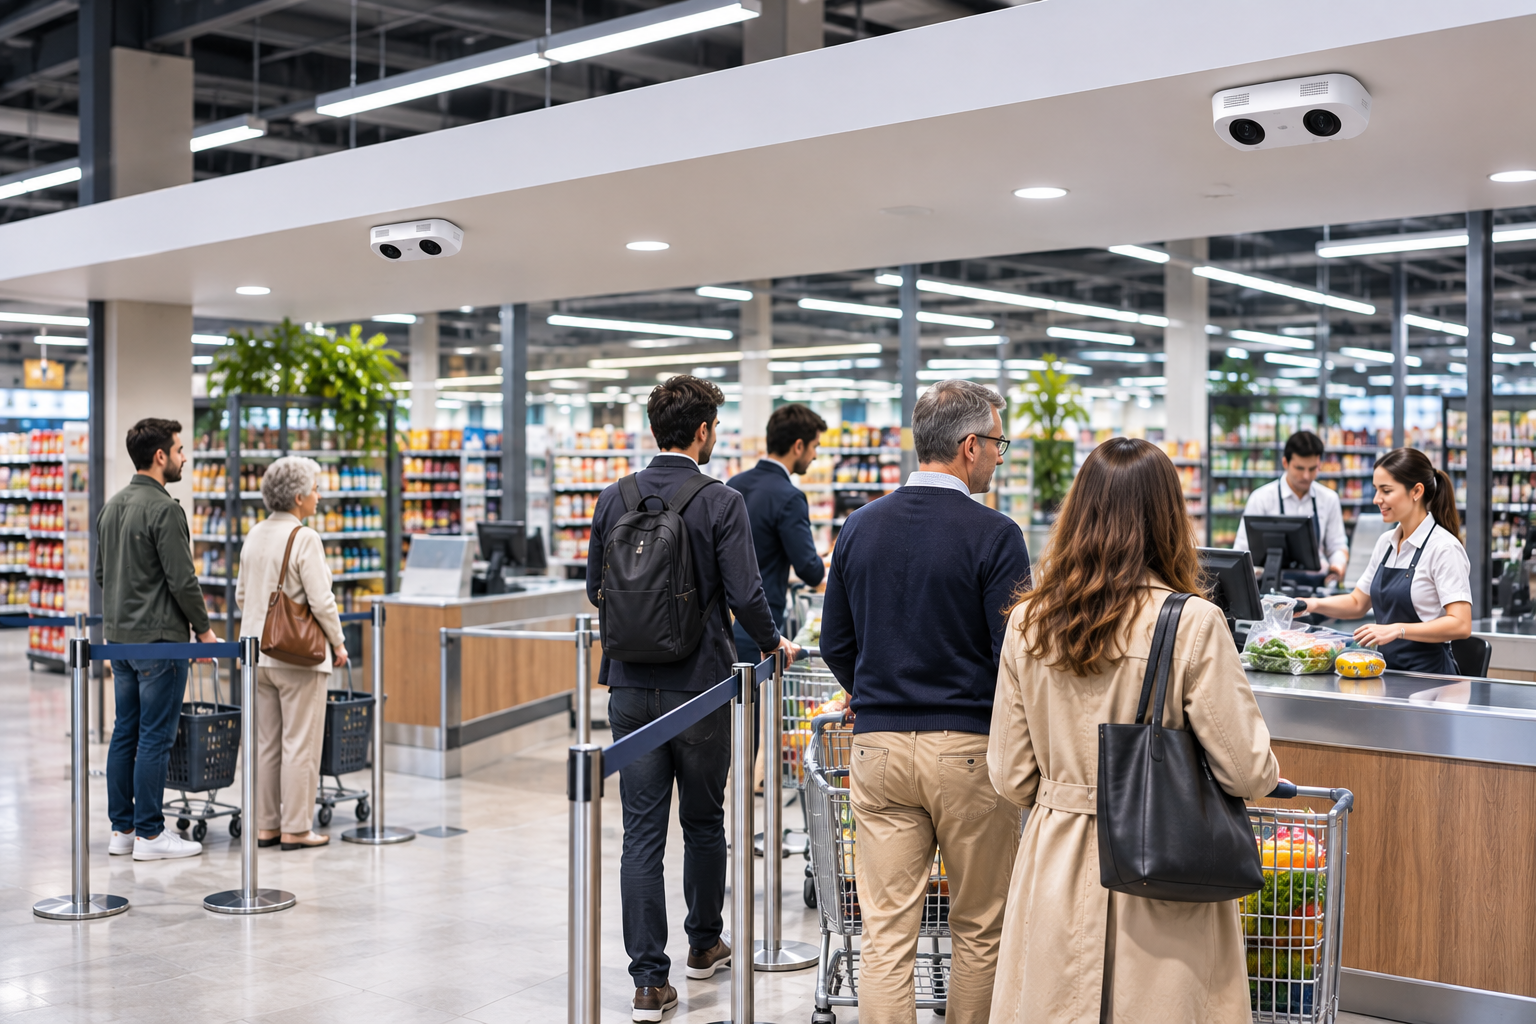
One of the important factors affecting customer experience in retail stores is the waiting time spent at the checkout after shopping is completed. Even if the customer has found the products they are looking for in the store, long queues at the payment point can negatively affect the shopping experience. For this reason, checkout operations should be evaluated not only based on the daily transaction count but also on actual customer density and service capacity.
Checkout queue analytics (Checkout Queue Analytics) is the general name for technological solutions aimed at analyzing the number of customers waiting at payment points, queue length, wait time, and checkout service capacity.
Using 3D people counting sensors, AI-powered video analytics, and appropriate software systems, the density in checkout areas can be measured. The data obtained supports operations managers in evaluating when additional checkouts should be opened and improving staff planning.
However, the number of people in the checkout queue, the customer's actual wait time, and the cashier's service time are different indicators.
Accurate checkout queue analytics is not just about counting people in the queue, but about measuring the relationship between customer demand and existing checkout service capacity.
What is Checkout Queue Analytics?
Checkout queue analytics is the automatic measurement and reporting of waiting behaviors occurring at payment and service points in stores.
Internationally, this technology is referred to by concepts such as Queue Analytics, Checkout Queue Monitoring, Queue Length Detection, and Queue Management Analytics.
Depending on the technical capabilities of the system used, the following information can be obtained:
Instantaneous number of people waiting in the queue.
Queue length per checkout.
Average customer wait time.
Longest and specific percentile wait times.
Number of customers reaching the checkout.
Checkout service time.
Hourly density change.
Checkout utilization rates.
Automatic notification when defined thresholds are exceeded.
Density forecasts based on historical data.
Comparative operational reports with POS and store visitor data.
All of this data is not obtained directly from a single camera or people counting device.
For example, a camera can detect six people waiting in a queue. However, based solely on this information, it is not possible to precisely calculate how many minutes each customer will wait.
To measure actual wait time, it is necessary to monitor the customer's entry into the queue and the start of service events, or to use an appropriate estimation model.
How Does Checkout Queue Analytics Work?
In checkout queue analytics, physical areas and events to be measured are first defined.
In a typical system, the checkout area can be divided into three basic stages.
1. Queue Entry
The moment the customer enters the defined queue area is determined.
This event can be used as the start of the wait time.
2. Waiting in Queue
The time a customer spends in the queue before proceeding to the payment point is evaluated.
Appropriate algorithms can track the number of people in the queue and the progression of the line.
3. Service Start and Service Completion
The moment a customer reaches the checkout and begins receiving service can be defined as the end of the wait time.
Completion of service at the checkout is a different event.
This distinction allows for separate measurement of queue wait time and checkout service time.
FootfallCam's queue analytics technical documentation explains the separate definition of the queue monitoring zone and the checkout service zone for this purpose.
However, accurate tracking depends on the sensor's field of view and the uninterrupted tracking of customer movement.
Key KPIs Measured in Checkout Queue Analytics
Different performance indicators can be used to evaluate checkout operations.
KPI | Description | Operational use |
|---|---|---|
Queue Length | Number of people in the queue | Density tracking |
Average Wait Time | Average waiting time | Customer experience |
Maximum Wait Time | Longest measured wait | Critical delays |
P90 / P95 Wait Time | Time within which 90%/95% of waits fall | Service level assessment |
Service Time | Time spent receiving service at the checkout | Checkout capacity |
Throughput | Number of transactions completed per unit time | Service productivity |
Queue SLA | Percentage of customers served within target time | Operational target |
Queue Abandonment | Customers who enter the queue but leave without service | Potential service loss |
Cashier Utilization | Percentage of time the checkout is busy with service | Capacity planning |
The measurement of these indicators depends on the hardware, software, and integration features used.
Especially the queue abandonment rate may require tracking actual customer behavior. A person leaving the queue area does not necessarily mean they have abandoned their shopping.
How is Checkout Queue Length Measured?
Queue length is the number of customers waiting in line at a specific payment point.
For example, let's assume a supermarket has four checkouts:
Checkout | Waiting in queue | Status |
|---|---|---|
Checkout 1 | 2 people | Low density |
Checkout 2 | 5 people | High density |
Checkout 3 | 4 people | Medium density |
Checkout 4 | 0 people | No queue |
The data is a hypothetical example created for illustrative purposes. Density classifications depend on thresholds set by the business.
This table shows that checkout queues can have different density levels simultaneously.
However, it should not be assumed that everyone standing in front of a checkout is waiting in a queue.
For example:
Customer talking to the cashier.
Person examining a product shelf.
Person accompanying a customer waiting at the checkout.
Customer passing by the queue.
Person waiting for their shopping cart.
can be mistakenly counted in the queue.
Therefore, the queue area, direction of movement, and service boundary must be correctly defined.
How is Average Checkout Wait Time Calculated?
Wait time is the duration between a customer joining the queue and starting to receive service at the checkout.
For example, let the wait times for four customers be 2, 3, 5, and 6 minutes, respectively.
The average wait time is calculated as:
However, using only the average value can hide long waits.
For example, in a store where many customers wait two minutes, a small number of customers waiting fifteen minutes may not be sufficiently visible through the average.
Therefore, P90 and P95 wait times should also be tracked.
A P90 wait time of five minutes means that approximately 90% of the evaluated wait records were five minutes or less.
This indicator can be particularly useful for comparing service levels in retail chains.
Difference Between Measured and Estimated Wait Time
Not all queue analytics systems directly measure the customer's actual wait time.
Some systems, using the number of people in the queue and the checkout service speed, calculate an estimated time.
For example, if customers are served at a checkout in an average of two minutes and there are three people in line, a simplified calculation would estimate the wait time to be approximately six minutes.
However, the size of shopping baskets, payment method, and cashier working conditions can affect this time.
Therefore, before a project, it should be verified whether the wait time feature specified in the catalog is actual timestamp measurement or an estimation model.
What is Checkout Service Time?
Checkout service time is the duration from the start of a customer's transaction to its completion.
This time may not only cover scanning products from barcodes.
Payment, campaign verification, age verification, bagging, and other processes can also affect the duration.
When evaluating checkout service performance, the following distinction is important:
Queue time: The time a customer waits for service.
Service time: The time a customer is being processed at the checkout.
Total checkout process: The time from entering the queue to the completion of service.
Confusing these three indicators can lead to misinterpretation of operational reports.
Checkout Queue Analysis with Little's Law
One of the important principles of queue theory is known as Little's Law.
This relationship explains the connection between average queue length, customer arrival rate, and average wait time under appropriate conditions.
Average number of people waiting in the queue.
Customer arrival rate to the relevant queue per unit time.
Average wait time in the queue.
For example, in a balanced checkout system where an average of two customers join the queue per minute and there are an average of six people in the queue,
Average queue wait time = 6 / 2 = 3 minutes
This calculation shows that the average wait time under the specified conditions will be three minutes.
However, for Little's Law to be applied correctly, the definitions of the number of people, arrival rate, and time used must be consistent.
Furthermore, this relationship does not provide a precise determination of each customer's wait time from a single snapshot during short-term density changes.
MIT's 2026 queuing models course material explains Little's Law as the fundamental relationship between queue length, arrival rate, and wait time.
Automatic Checkout Opening Alert with Artificial Intelligence
One of the operational uses of checkout queue analytics is to send an alert to store management when density reaches a certain level.
For example, the following rule can be defined in a store:
Example checkout opening alert scenario
5 people
45 sec
Rule: If the queue consists of five or more people for at least 45 seconds, a notification is sent to the store manager to evaluate opening an additional checkout.
The values are for example purposes; they are not mandatory or recommended settings from a specific manufacturer.Such a rule can enable the manager to detect density earlier.
However, issuing the alert and actually opening the checkout are different operations.
To open an additional checkout, suitable staff, a functional checkout, and necessary operational conditions must be available.
Preventing False Alarms and Unnecessary Checkout Openings
A short-term exceedance of the queue length threshold may not always require opening an additional checkout.
For example, a few seconds of density caused by customers arriving in a group may decrease on its own.
Therefore, threshold durations, re-alert intervals, and when queue density returns to normal should be defined.
Instead of alerting at high density and removing the alert with a very small decrease, unnecessary notification repetitions can be reduced by using different opening and return-to-normal thresholds.
Staff Planning in Checkout Queue Analytics
One of the key elements affecting checkout performance is the balance between customer demand arriving at specific time intervals and the number of open checkouts.
For example, in a hypothetical store where 90 customers per hour head to the checkout, let the average service capacity of one checkout be 40 customers/hour.
The theoretical total capacity of two open checkouts is:
In this case, the average hourly demand is higher than the specified service capacity.
If three checkouts are open, the theoretical capacity increases to:
However, this calculation does not guarantee that all queues will disappear with the opening of the third checkout. The distribution of customer arrivals, workload between checkouts, and variability in transaction times affect wait times.
In operational planning:
Hourly customer demand.
Actual checkout transactions.
Average service time.
Number of open checkouts.
Staff shifts.
P90/P95 wait times.
should be evaluated together.
3D People Counting and Video Analytics for Checkout Queue Measurement
Different sensor technologies can be used in checkout queue analytics.
3D People Counting Sensors
3D sensors, depending on the technology used, can evaluate the positions of people in specific areas with depth information.
Appropriate ceiling-mounted devices can be used to measure movements between the queue area and the service point.
However, it should not be assumed that every 3D sensor offering basic bidirectional entry-exit counting can measure queue wait time.
This may additionally require queue analytics software or appropriate regional tracking functions.
AI-Powered IP Cameras
With compatible IP cameras and analytics software, the number of people in the checkout area and specific waiting situations can be analyzed.
Hikvision's official queue management solution explains that notifications can be generated when the number of people in a defined queue area or the wait time exceeds specified thresholds.
AXIS Object Analytics, on the other hand, offers area occupancy, dwell time in a specific region, and people counting scenarios on supported devices.
However, standard CCTV video recording capability does not mean that queue analytics functionality is available.
Technology Comparison
Technology | Purpose of use | Technical limitation |
|---|---|---|
3D people counting and queue analytics | Measuring people and movement in the queue | Installation and software compatibility |
AI video analytics | Queue area, people density, some time analyses | Field of view, overlap, and algorithm |
Standard CCTV | Security monitoring | Does not measure wait time without additional analytics |
POS data | Completed transactions and transaction times | Does not directly show those waiting in queue |
Manual observation | Reference measurement and validation | Continuity and staffing requirements |
The correct technology selection should begin with clearly defining the KPIs to be measured.
POS Integration in Checkout Queue Systems
Evaluating checkout queue analytics together with the POS (Point of Sale) system can expand the scope of operational reports.
While the POS system provides data on completed sales and payment transactions, queue analytics can offer measurements related to waiting behavior before payment.
When these two data sources are used together:
Hourly sales transactions.
Number of open checkouts.
Queue density.
Transaction density.
Checkout service capacity.
Wait time changes during peak hours.
can be compared.
However, POS transaction timestamps should not be assumed to perfectly match the moment a customer starts or finishes receiving service at the checkout.
The start or end of a POS transaction may represent different moments depending on the system's operation.
Therefore, time synchronization and event matching rules should be defined between the POS and analytics system.
The What is a Store Customer Counter? guide on GüvenlikOnline provides complementary information on relating store entry traffic to commercial data.
Which Businesses Use Checkout Queue Analytics?
Supermarkets and Retail Chains
In markets with high daily customer density, monitoring queues at checkouts can support staff and open checkout planning.
Apparel and Retail Stores
Especially during discount periods and campaign days, density at payment points can be analyzed.
Electronics and Technology Stores
Product consultation, warranty processes, and payment procedures may require different durations.
Therefore, separate evaluation of service point and payment checkout analytics may be appropriate.
DIY Stores
Different sizes of shopping carts, bulky products, and variable transaction times can affect the design of queue analytics.
Restaurants and Cafes
Ordering, payment, and order pickup queues can be separated.
Banks and Service Centers
Queue waiting and service capacity analysis can also be applied in customer service processes under appropriate data protection conditions.
However, the data security requirements of banking, healthcare, and other private sectors should be evaluated separately.
Common Measurement Errors in Checkout Queue Systems
Incorrect Definition of Queue Area
If all people around the checkout are considered to be in the queue, counting errors can occur.
Confusing Wait Time with Service Time
The moment a customer reaches the checkout and the moment they complete payment are different. Where the wait time ends must be defined beforehand.
Failure to Distinguish Between Open and Closed Checkouts
People standing in front of a closed checkout or moving staff can be misinterpreted.
Shopping Carts Affecting Detection
Shopping carts, checkout equipment, and people obscuring each other can affect the accuracy of video analytics.
Customers Changing Queues
A customer moving to a different checkout can create separate events in two queues if there is no appropriate tracking mechanism.
Using Average Time as the Only KPI
A low average wait time does not mean that no customer waited for a long time.
Failure to Include Data Loss in Reports
Measurement gaps that occur when the sensor goes offline or does not transmit data should be indicated in reports.
How to Test Accuracy in Checkout Queue Analytics?
In queue analytics projects, testing should not be limited to only the number of people detected.
Separate validation should be performed for different KPIs.
Queue Length Accuracy
The number of people waiting, manually counted at specific times, is compared with the results of the analytics system.
For example, if the manual reference count is 8 people and the system count is 7 people, the absolute counting error is 1 person.
Percentage error is calculated as:
This is the error calculated for a single sample; it does not represent the overall accuracy of the system.
Wait Time Accuracy
To validate wait time, the moments when people join the queue and start service can be compared with manual timestamps.
For example:
Reference wait time: 240 seconds.
System measurement: 255 seconds.
Absolute time error: 15 seconds.
This result shows that in the sample measurement, the system calculated 15 seconds of excess wait time.
Indicators such as mean absolute error (MAE), percentile errors, and the rate of correct detection of long waits can be used in validation.
In Which Scenarios Should Validation Be Performed?
Short and long queues.
Peak shopping hours.
Customers standing very close to each other.
Children and shopping carts.
Customers changing queues.
Self-checkout areas.
Single line - multiple checkout layout.
Different lighting conditions.
Partial obstruction of camera or sensor view.
Checkout opening and closing changes.
It is not sufficient for the system to work successfully only during empty or low-density hours.
Especially the error distribution during peak hours should be examined separately.
KVKK and Privacy in Checkout Queue Analytics
The checkout area is a heavily trafficked area for customers and employees.
Therefore, the personal data processing behavior of the imaging and analytics systems used is important.
Some analytics devices may only export aggregated people count or density data. Others may process video recordings, individual movement tracking, or different identifiers.
The generation of anonymous counting data does not mean that no personal data is processed at any stage of the device's data processing workflow.
The official statement of the Personal Data Protection Authority regarding security cameras in workplaces emphasizes data minimization, purpose limitation, proportionality, and employee privacy.
In checkout queue analytics projects:
The purpose of data processing must be defined in advance.
Images should not be stored if not necessary.
If personal data is processed, the legal basis should be evaluated.
Customers and employees should be appropriately informed.
Access authorizations should be restricted.
Storage and destruction periods should be determined.
More intrusive methods such as audio recording should be avoided.
Data transfer conditions of cloud services should be examined.
Furthermore, customer queue analytics and continuous monitoring of individual employee performance are different purposes.
Such additional data processing activities cannot be automatically legitimized through the initial purpose of system installation.
How to Choose the Right System for Checkout Queue Analytics?
In system selection, instantaneous people counting or AI support alone are not sufficient criteria.
First, the store's queue architecture should be evaluated.
Separate checkout queues: Each checkout has its own waiting line.
Single line – multiple checkouts: Customers are directed from a common queue to an available checkout.
Self-checkout areas: Multiple automatic payment terminals may be present.
Hybrid checkout layout: Traditional checkouts and self-checkout points operate together.
The same sensor placement or algorithm configuration may not be usable for these different queue architectures.
Technical Selection Criteria
Criterion | Issue to be checked |
|---|---|
Queue architecture | Separate checkout, common line, or self-checkout |
Detection area | Coverage of the entire waiting area |
People counting | Distinguishing between stationary and moving people |
Wait time | Actual measurement or estimation method |
Checkout status | Distinction between open, closed, out of service |
Alerts | People and time thresholds |
POS integration | Transaction data and time synchronization |
Reporting | Average, P90/P95, density, and historical data |
Accuracy | Field validation and acceptance criteria |
Data security | KVKK and access controls |
Multi-store | Centralized reporting and branch comparison |
Technical Checklist for Checkout Queue Analytics
The following checks should be performed during the project discovery and commissioning phases:
- Have all checkout and service points been mapped?
- Have the queue architecture and waiting areas been defined?
- Have checkout entry, service start, and service end been defined?
- Have the KPIs to be measured been determined?
- Are the sensor's field of view and mounting height appropriate?
- Have the coverage areas of multiple sensors been verified?
- Have shopping carts and passing individuals been tested?
- Can average and P90/P95 wait times be measured?
- Is the distinction between actual measurement and estimated time clear?
- Have automatic checkout opening alert thresholds been defined?
- Have rules for preventing false and repeated alerts been created?
- Has POS and store entry traffic integration been evaluated?
- Have system clocks been synchronized?
- Is data loss monitored when the sensor goes offline?
- Has accuracy testing been performed with manual reference measurements?
- Have KVKK requirements and user permissions been checked?
- Has periodic calibration and maintenance been planned?
Frequently Asked Questions About Checkout Queue Analytics
What is checkout queue analytics?
It is an analytics system that measures the number of customers waiting at checkouts, queue density, wait time, and specific service performance indicators.
How does checkout queue analytics work?
Customer movements in the defined queue area are analyzed using cameras or appropriate sensors. In supported systems, information on queue entry, service start, and queue density can be reported.
How is checkout wait time calculated?
It can be calculated based on the difference between the customer's queue entry time and service start time. Some systems use estimation methods based on queue length and processing speed.
How is checkout queue length measured?
People in the defined queue area are detected using appropriate sensors or image analytics, and the estimated number of people in the queue is determined.
Can artificial intelligence enable automatic checkout opening?
Appropriate systems can generate an alert indicating that a checkout should be opened. However, actual checkout opening requires suitable staff, checkout status, and operational conditions to be met.
Can checkout queue analytics be used with existing CCTV cameras?
It may be possible with supported cameras and analytics software. However, standard CCTV recording capability alone does not provide queue analytics support.
Does checkout queue analytics increase sales?
It can contribute to better wait management, supporting the improvement of customer experience. However, it does not alone guarantee increased sales or a specific return on investment.
Are checkout queue analytics and people counting systems the same?
No. Store people counting systems typically measure visitor entries and exits. Checkout queue analytics, on the other hand, focuses on waiting and service processes at the payment point.
Can checkout queue analytics be used in self-checkout systems?
Yes. Appropriate systems can evaluate the queue and density status of automatic payment points. However, the self-checkout layout and service flow must be defined separately.
Is checkout queue analytics compliant with KVKK?
Compliance depends on what data the technology processes and the data protection measures implemented. Processing aggregated anonymous data versus personal image or movement data may entail different requirements.
Conclusion: Data-Driven Store Management with Checkout Queue Analytics
Checkout queue analytics is an important operational analysis solution that enables retail businesses to evaluate customer waiting behavior at payment points in more detail.
Evaluating queue length, wait time, checkout service capacity, and peak hours together can support staff planning, checkout opening decisions, and customer experience management.
However, the number of people in the checkout queue alone does not explain customer wait time or service quality.
This is why, in a correct solution, measurement methods for different KPIs should be clearly defined, complementary data such as POS and store traffic should be appropriately evaluated, and field accuracy should be verified with manual reference measurements.
The primary goal of a successful checkout queue analytics project is not to collect more data, but to produce reliable data that enables operational decisions to be made at the right time.